Watson News Explorer
Transforming news into interactive information networks
Making Sense of the News Ecosystem
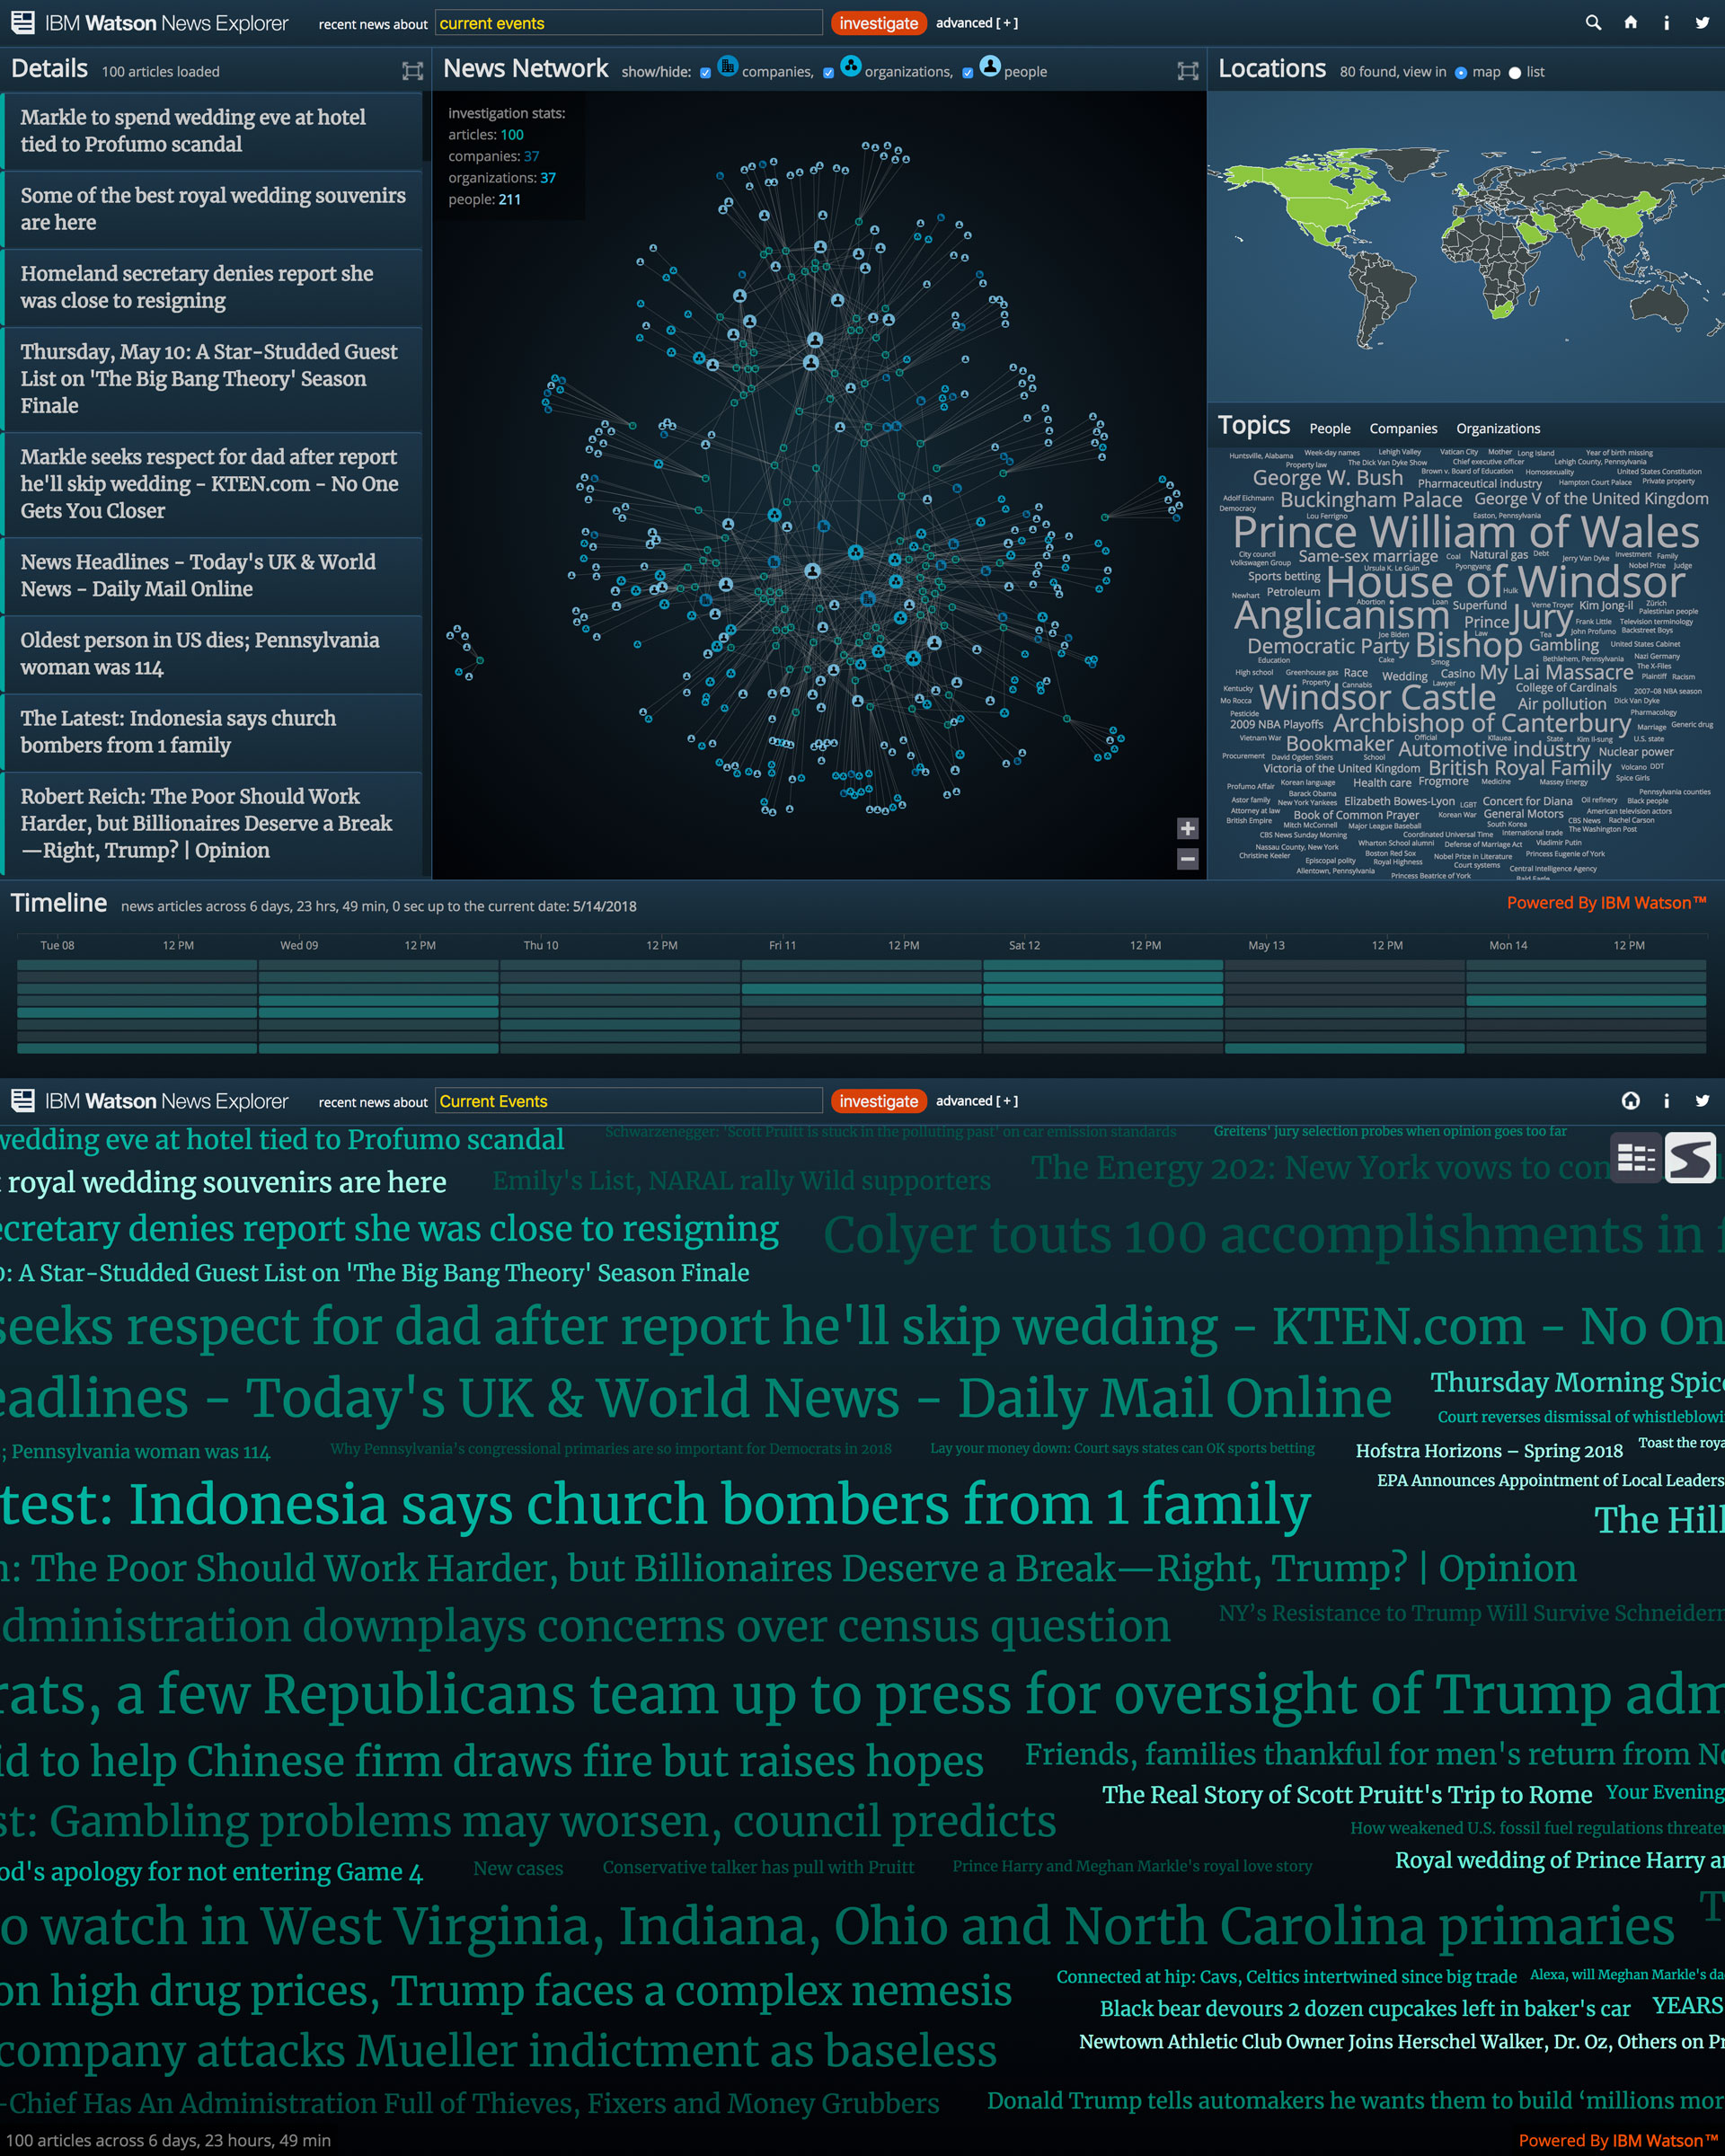
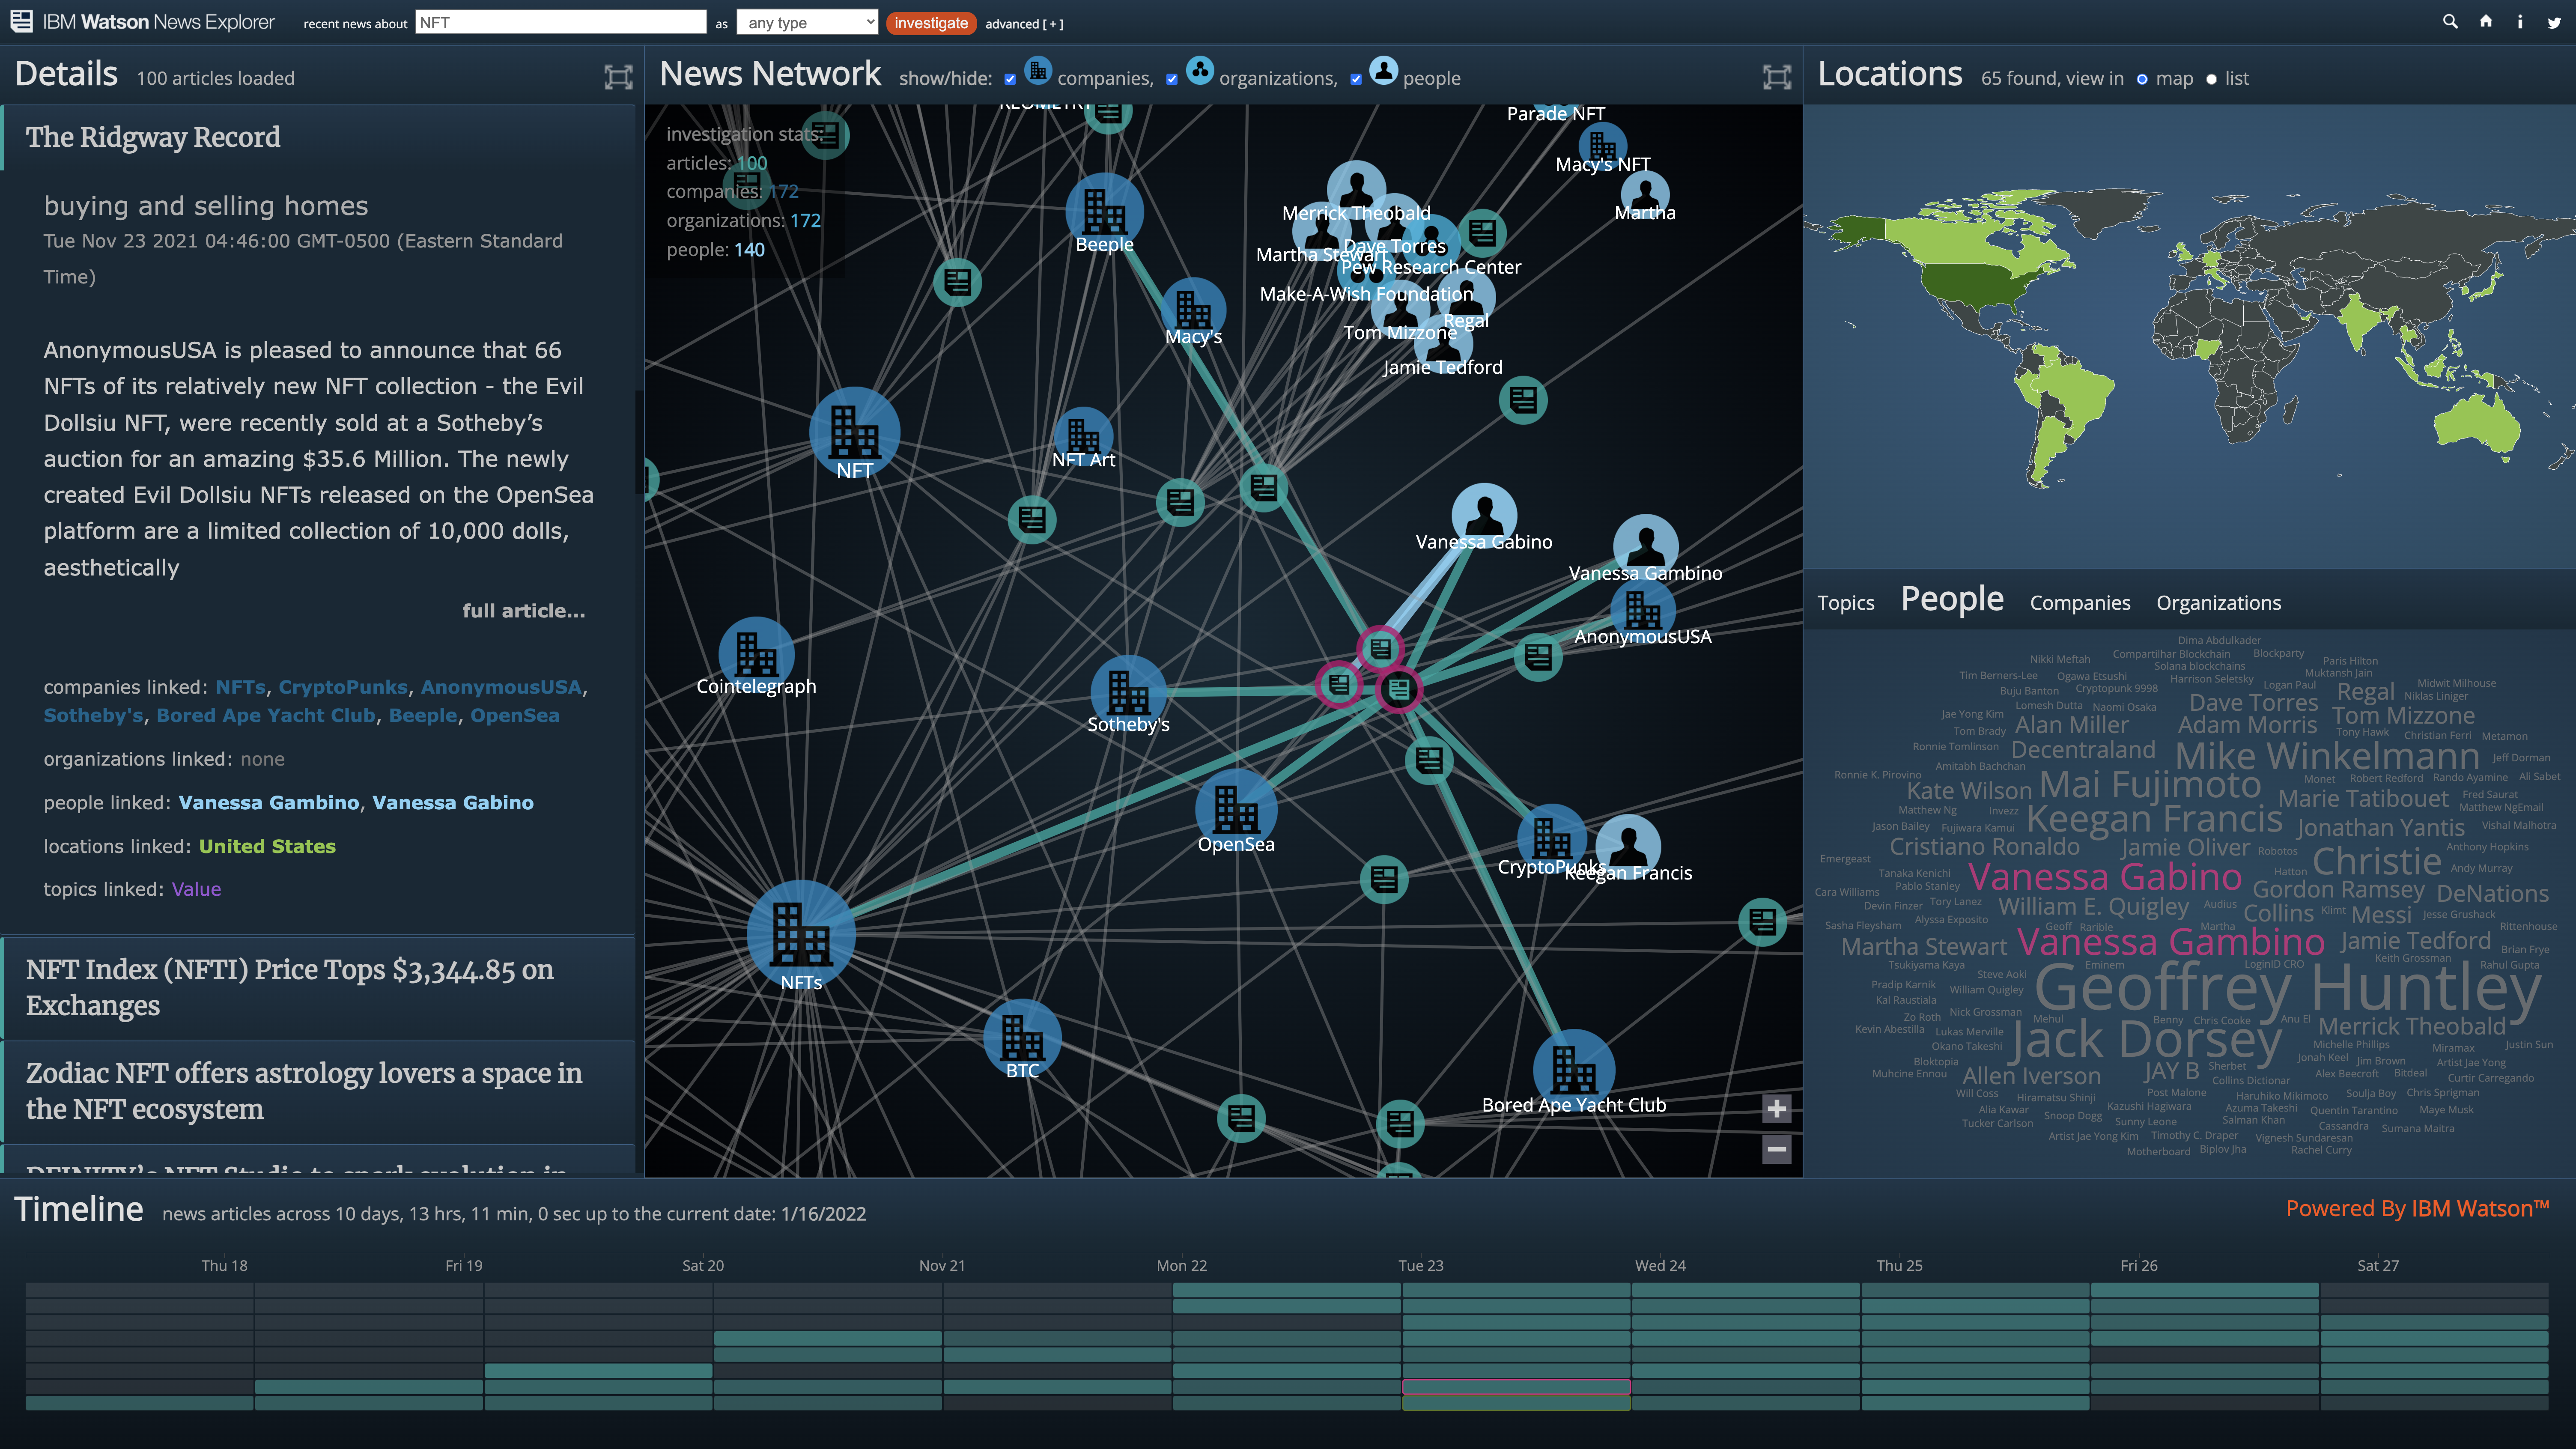
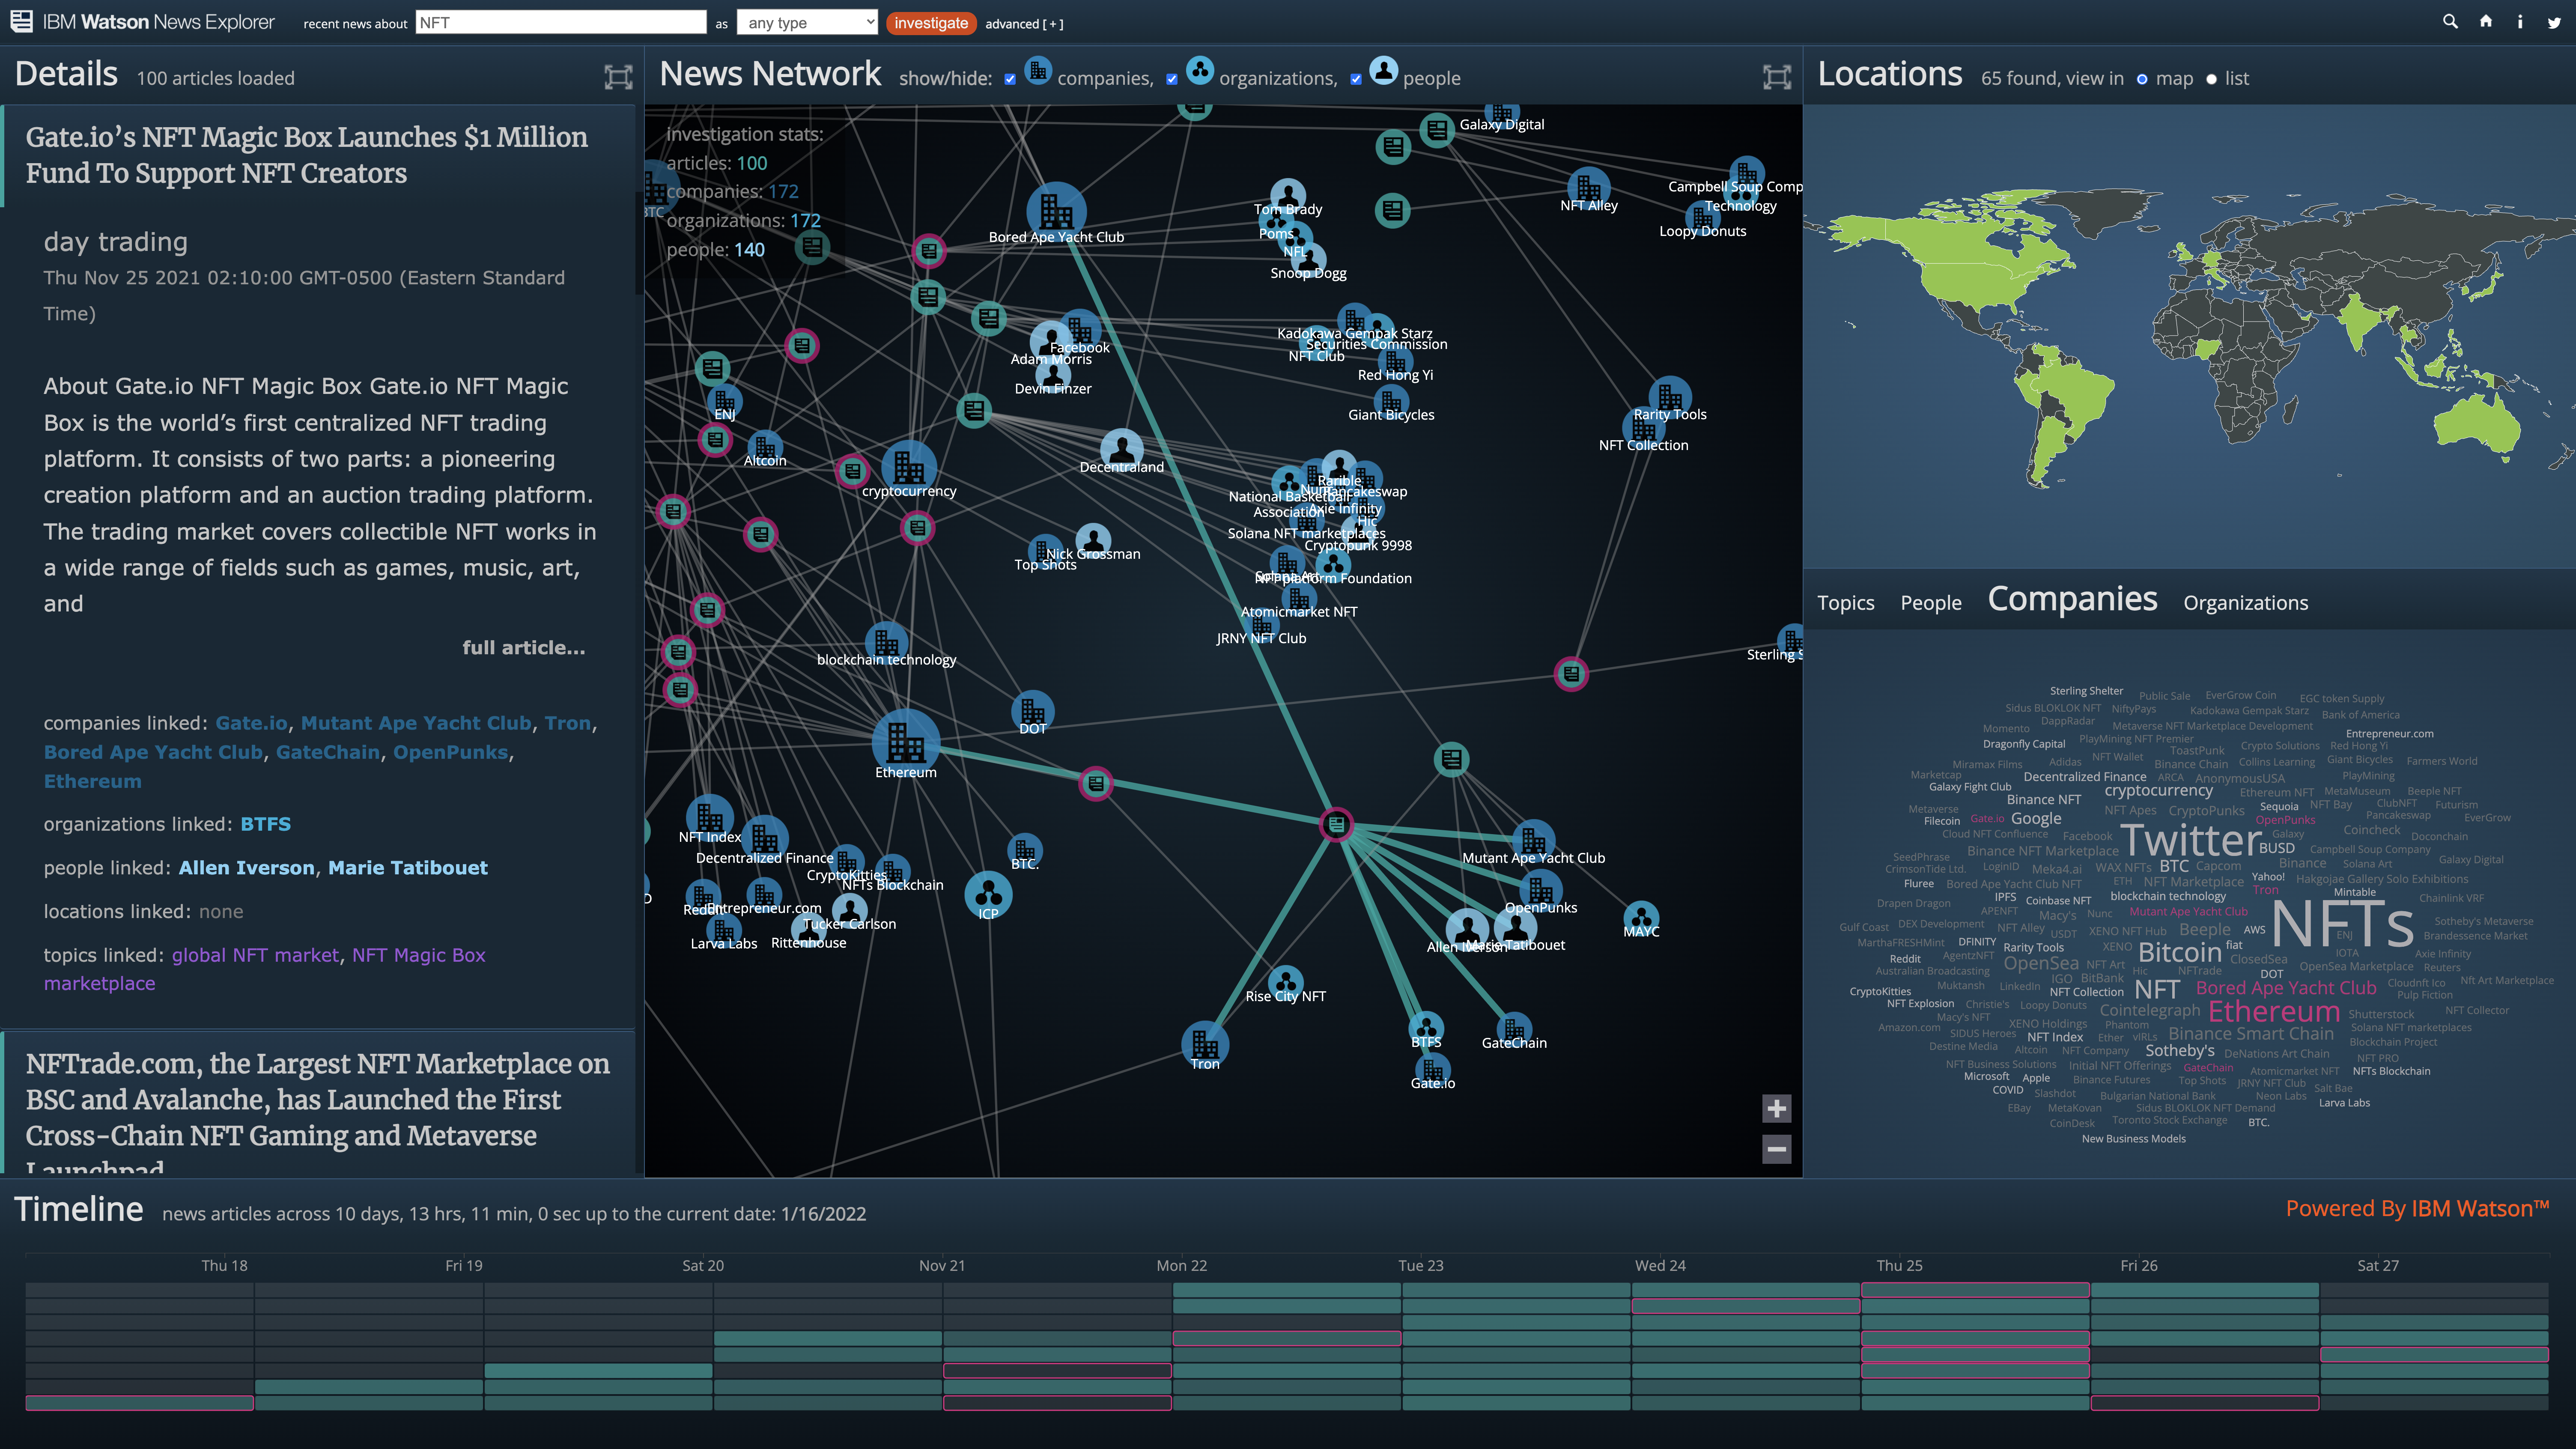
Watson News Explorer is an award-winning dashboard that allows users to explore the themes surfacing across the news ecosystem. By leveraging IBM Watson's natural language processing capabilities, the tool automatically constructs information networks from news data, revealing hidden connections between stories, people, organizations, and locations.
How It Works
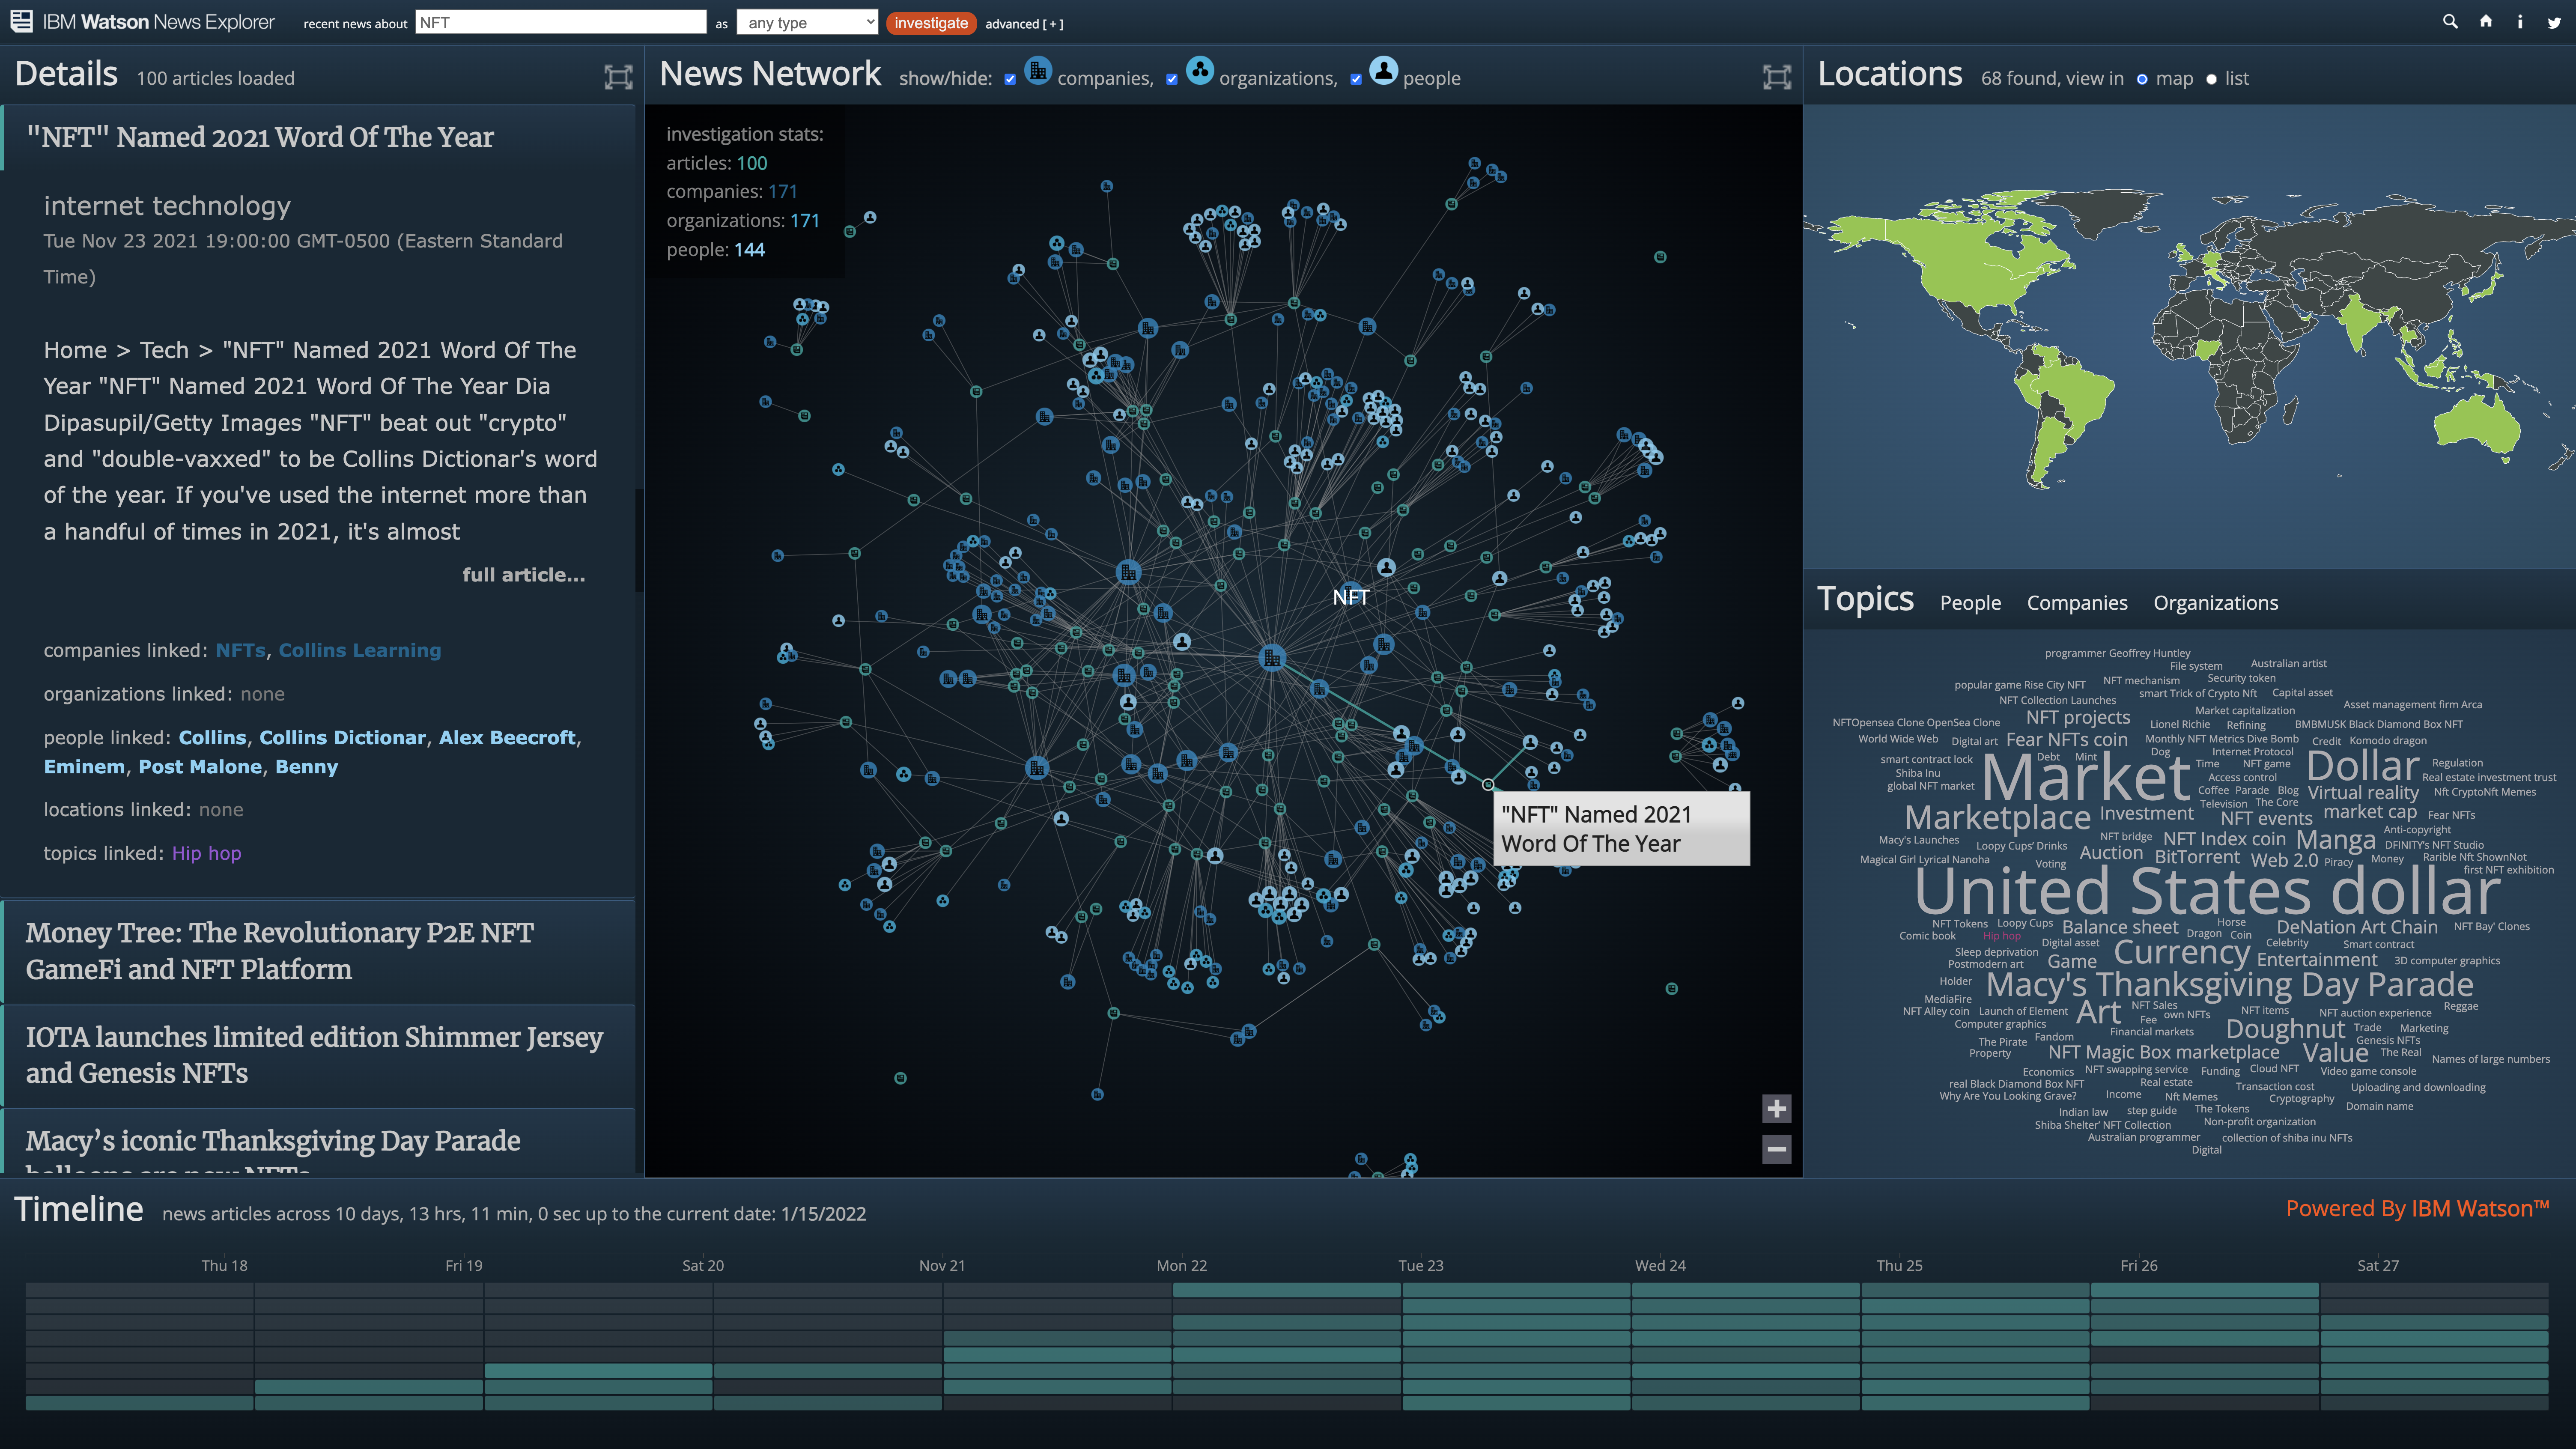
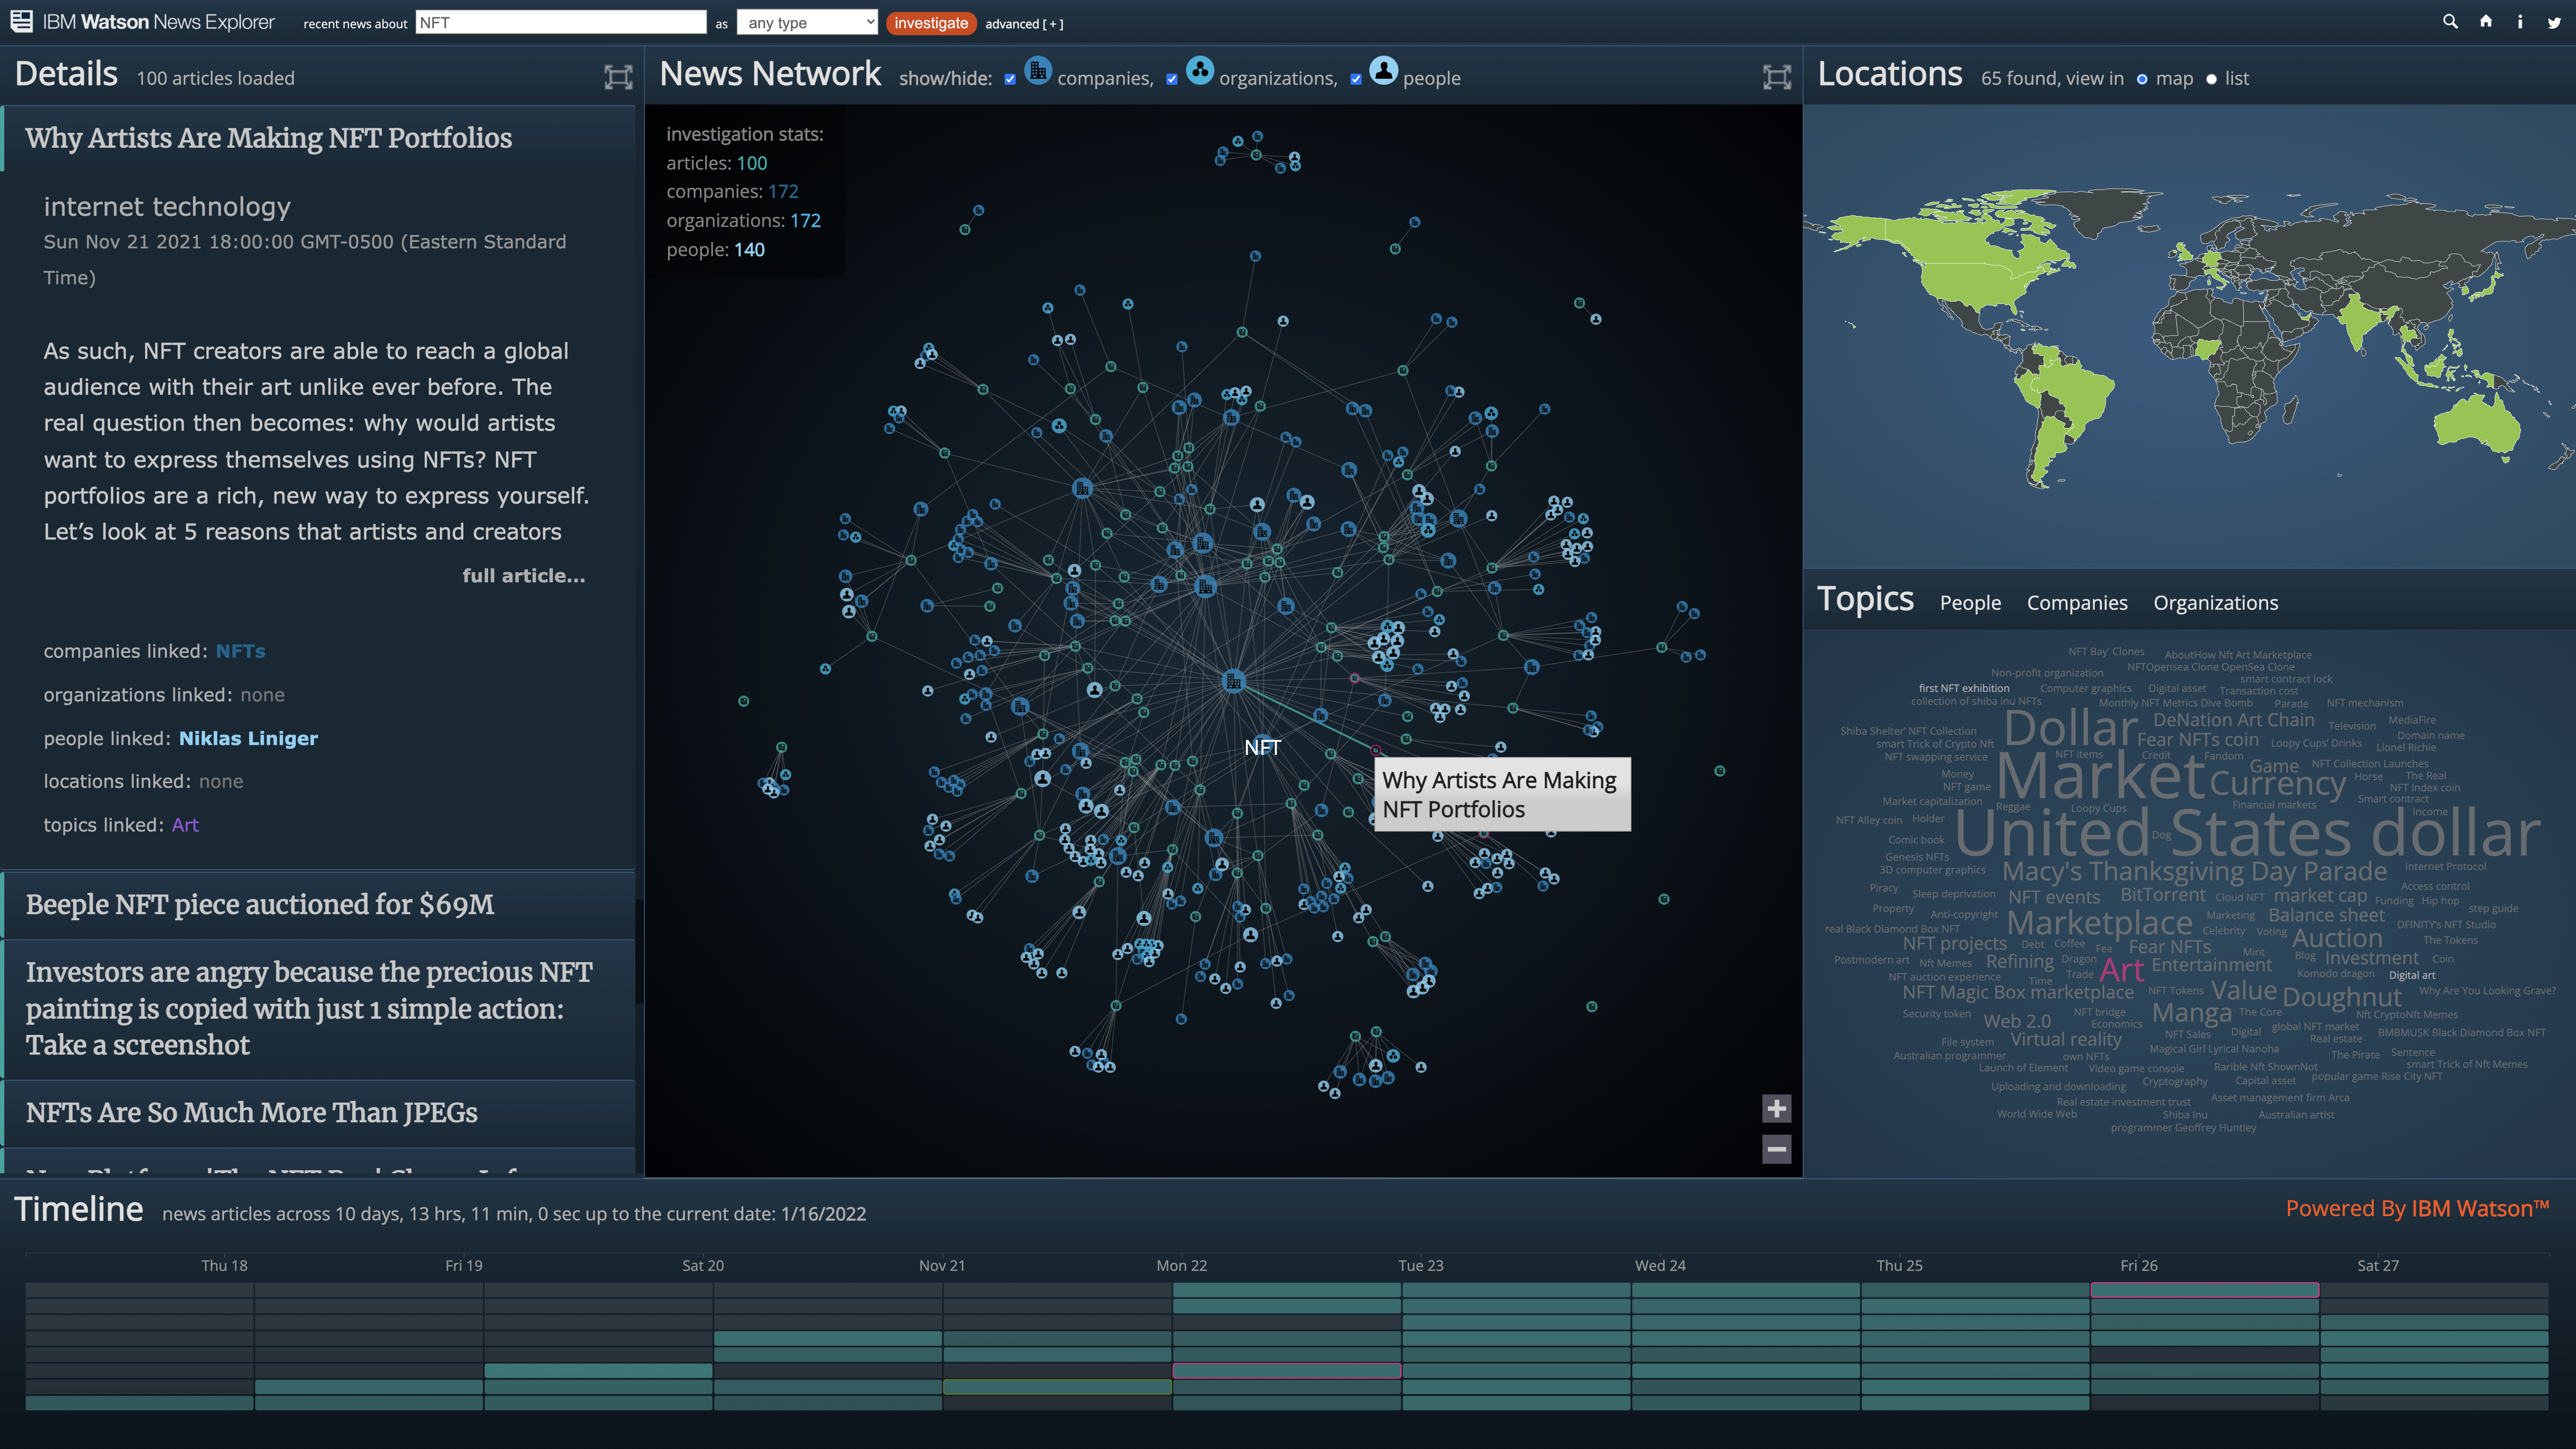
The application combines the AlchemyData News API with the d3.js visualization library to automatically construct news information networks. Natural language processing identifies topics and key entities - including locations, organizations, companies, and people - constructing an interconnected information network that users can explore interactively.
Automatic Network Construction
News data is automatically organized into interconnected visual networks
Entity Extraction
NLP identifies people, places, organizations, and concepts in articles
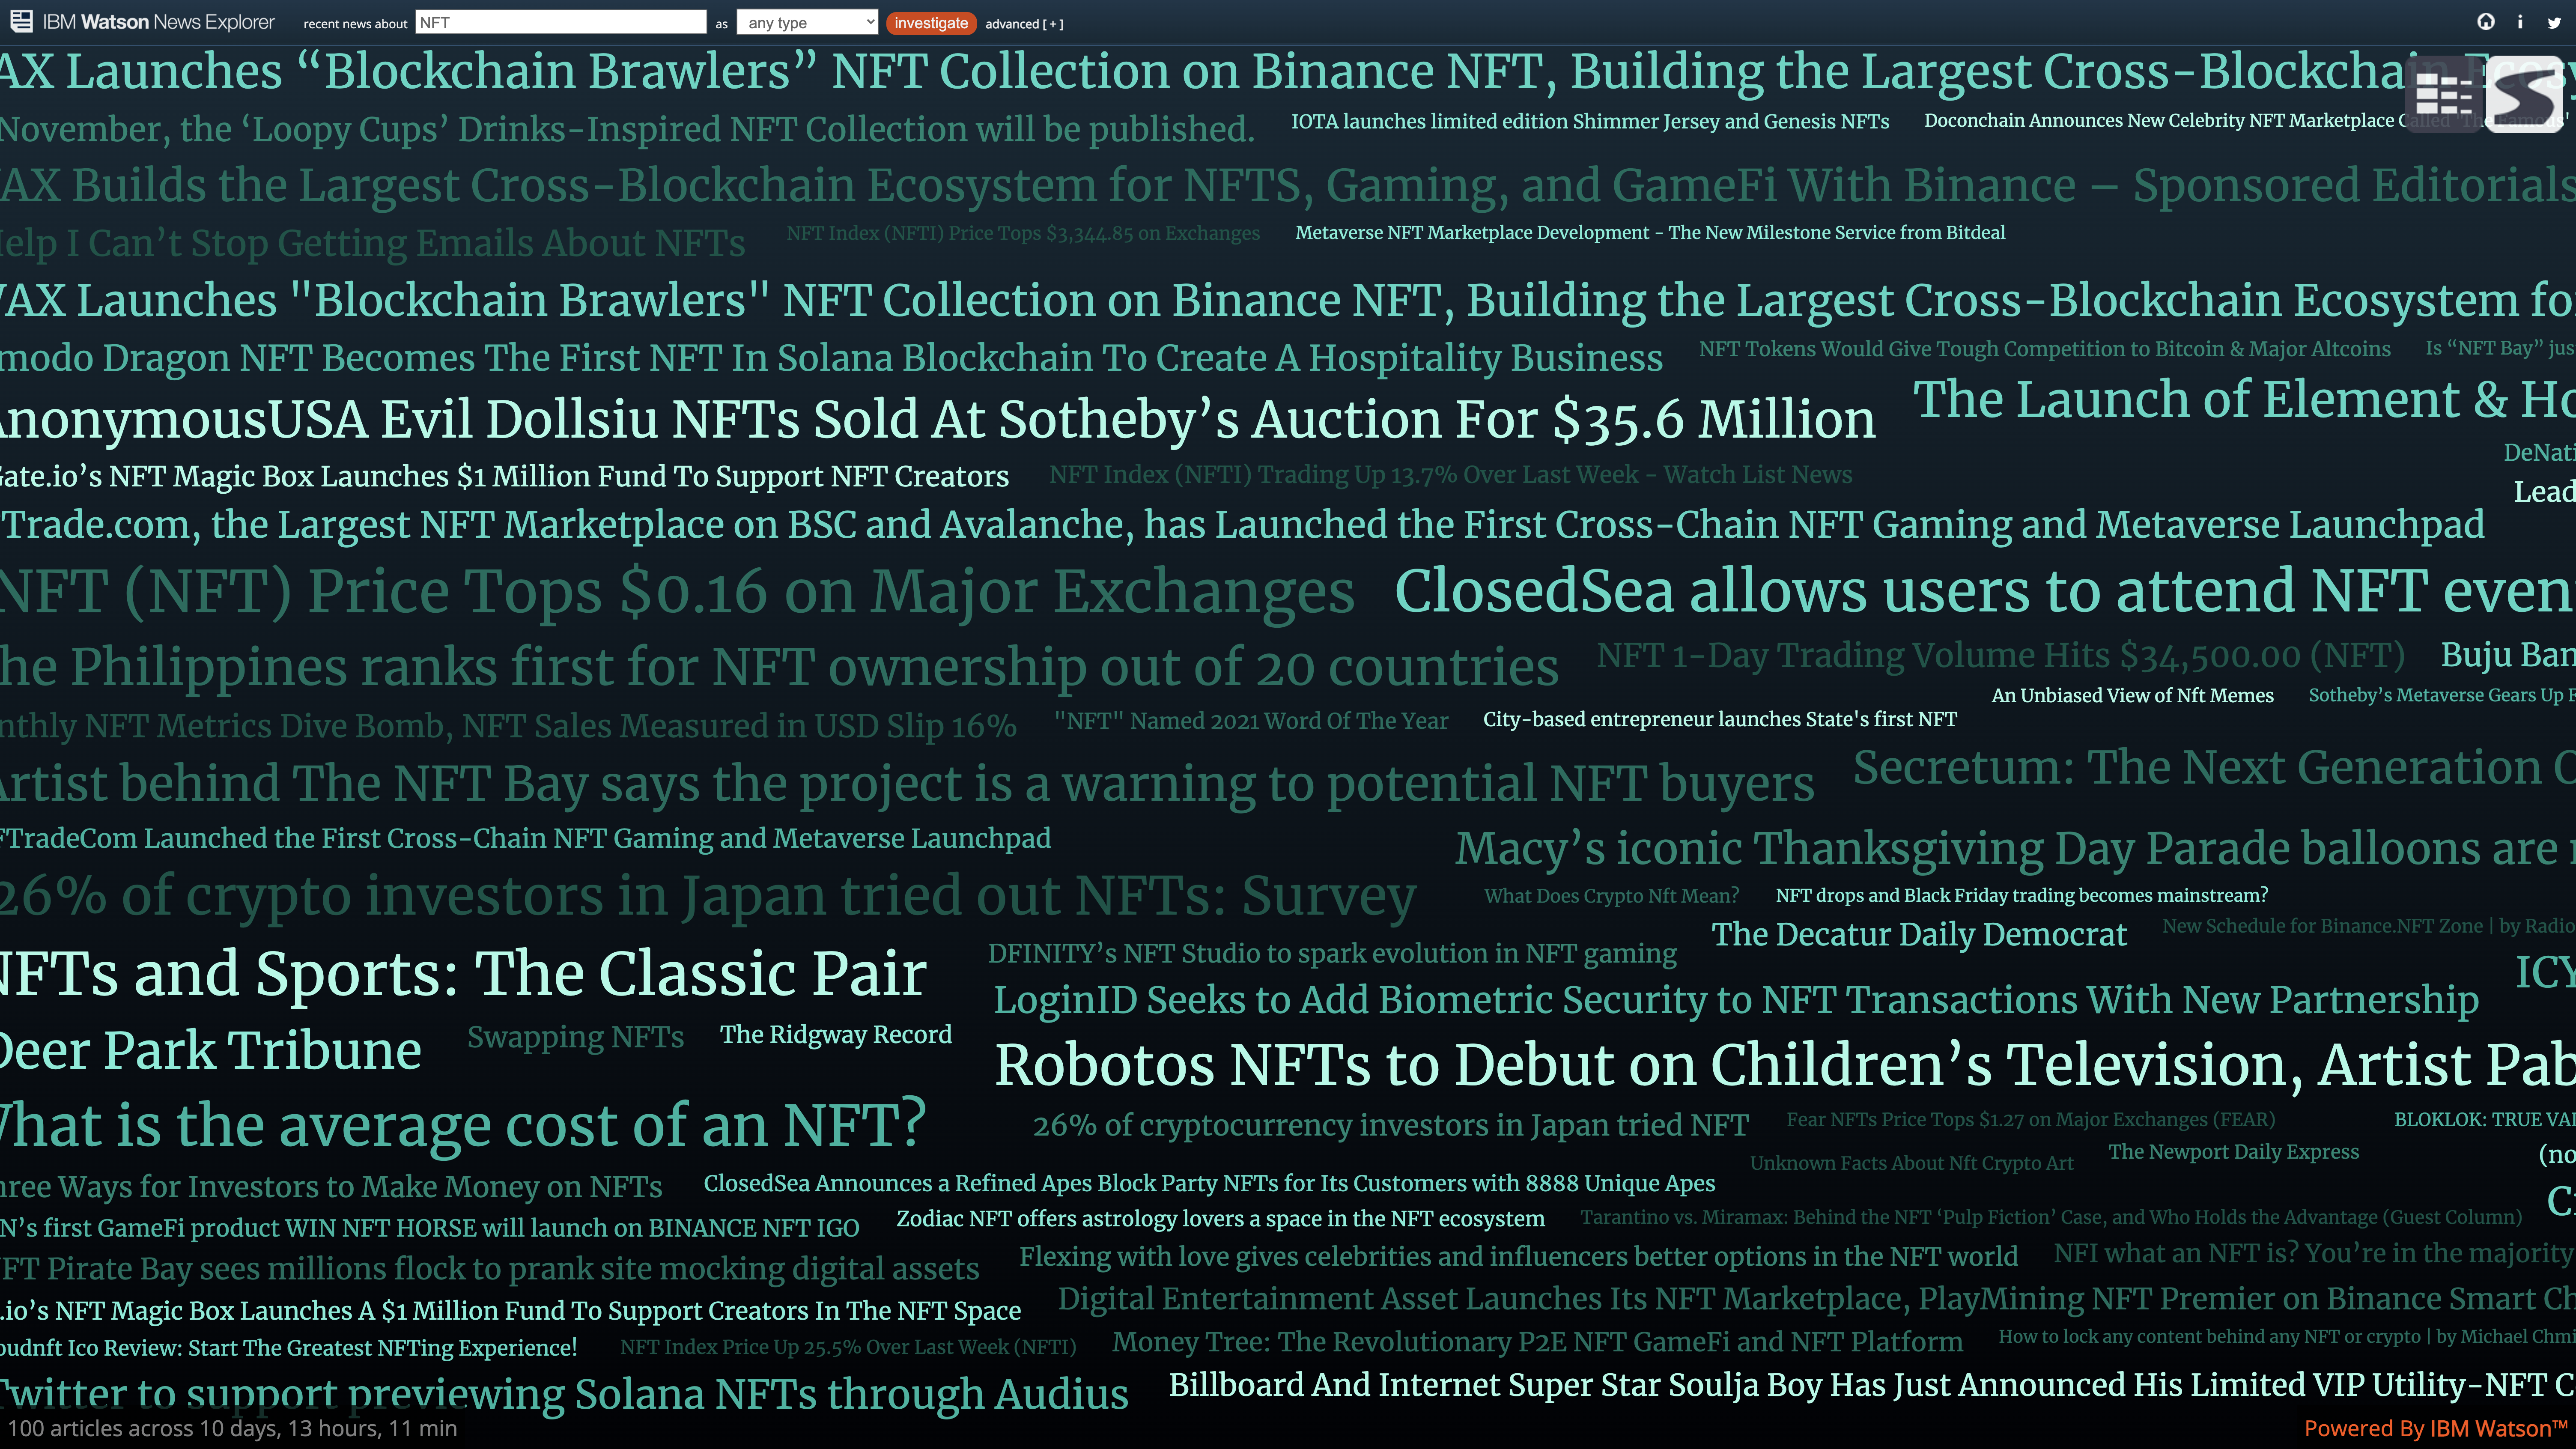
Linked Visualizations
Multiple interactive views enable discovery of relevant articles
Real-time Analysis
Different interpretations of reality, predictions, and synthesis in real-time
AI as a Research Partner
News Explorer embodies our philosophy of treating artificial intelligence as a research partner rather than something to fear. Machine learning helps identify different types of topics, styles and language used, and the emotion that emerges from text analysis. It creates a partnership between people and computers, accelerating human knowledge and expertise.
Recognition
The project received the prestigious Kantar Information is Beautiful Award in 2016 (Silver) and was featured in MIT Press's book "Atlas of Macroscopes: Interactive Data Visualizations", cementing its place as a landmark achievement in news data visualization.