Paper Graph
Visualizing the landscape of research literature
Navigating the Scientific Knowledge Graph
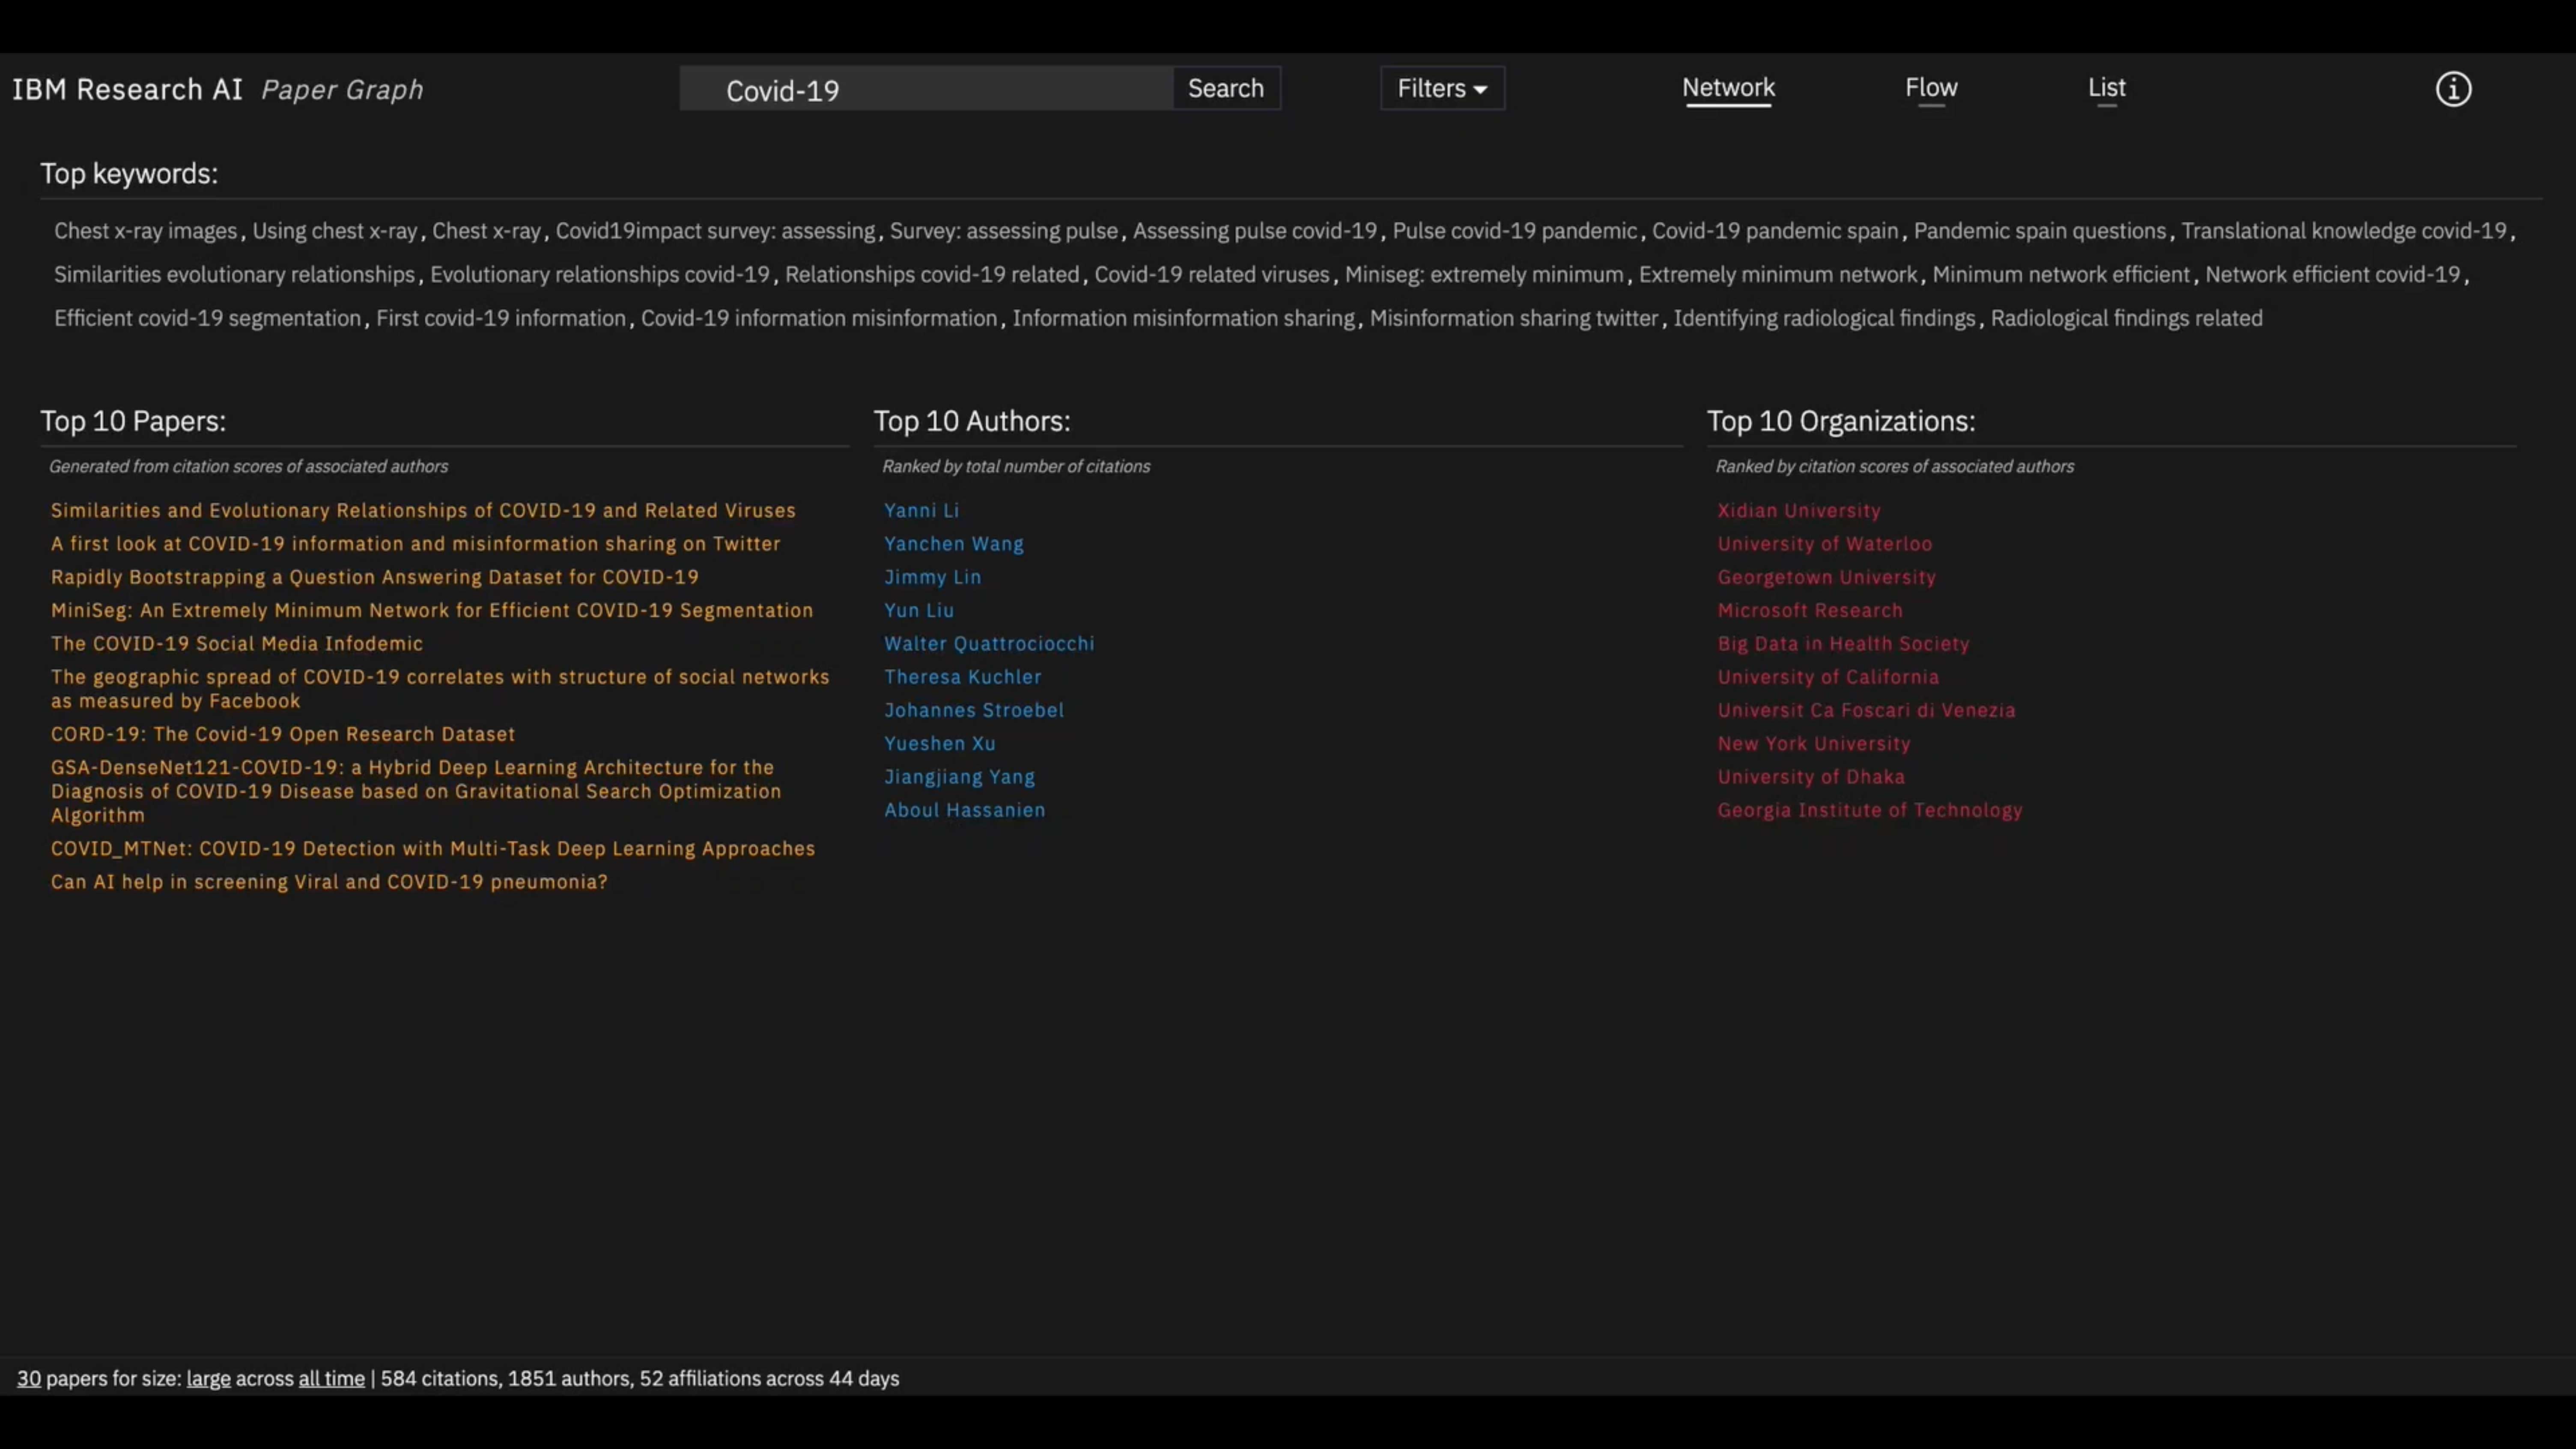
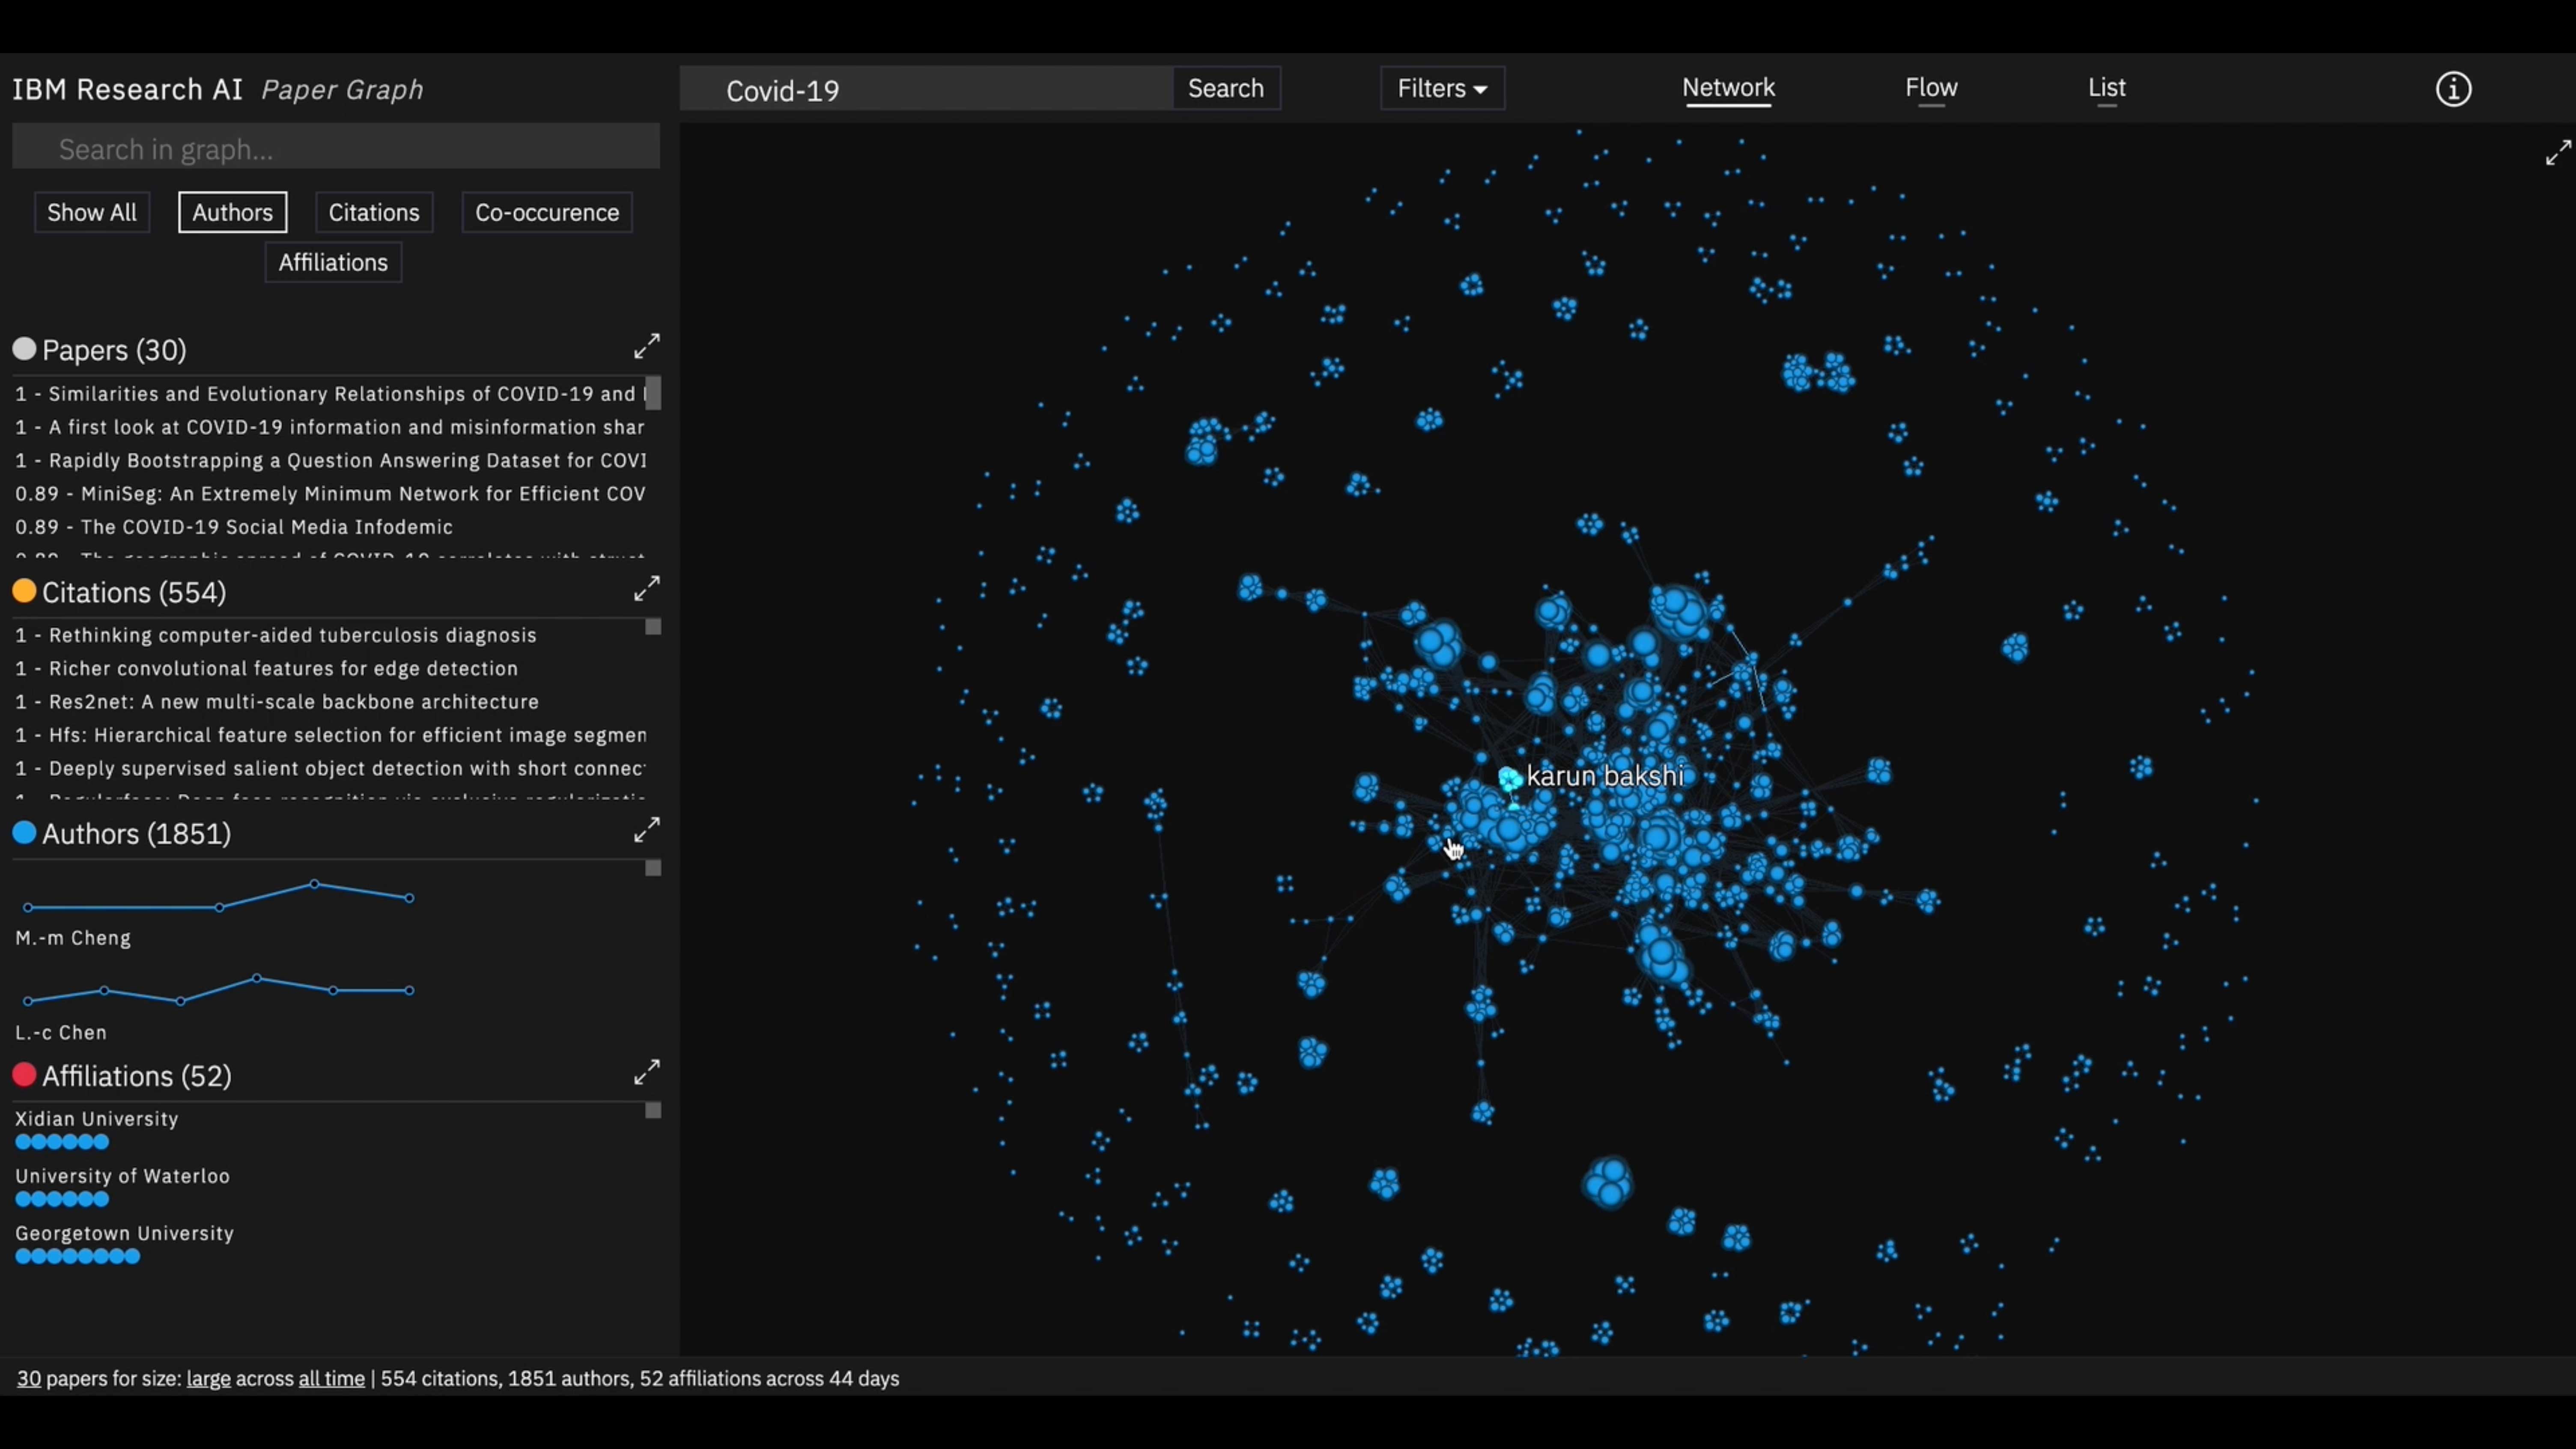
Paper Graph is an interactive visualization tool designed to help researchers navigate and understand the complex landscape of academic literature. The system queries the Arxiv database and transforms research papers into an explorable network graph, revealing hidden connections between papers, authors, and institutions.
The Challenge
In an era of exponentially growing scientific output, keeping up with relevant research has become increasingly challenging. Traditional search engines return flat lists of results, failing to show how papers relate to each other. Researchers need tools that reveal the structure of scientific knowledge, not just individual documents.
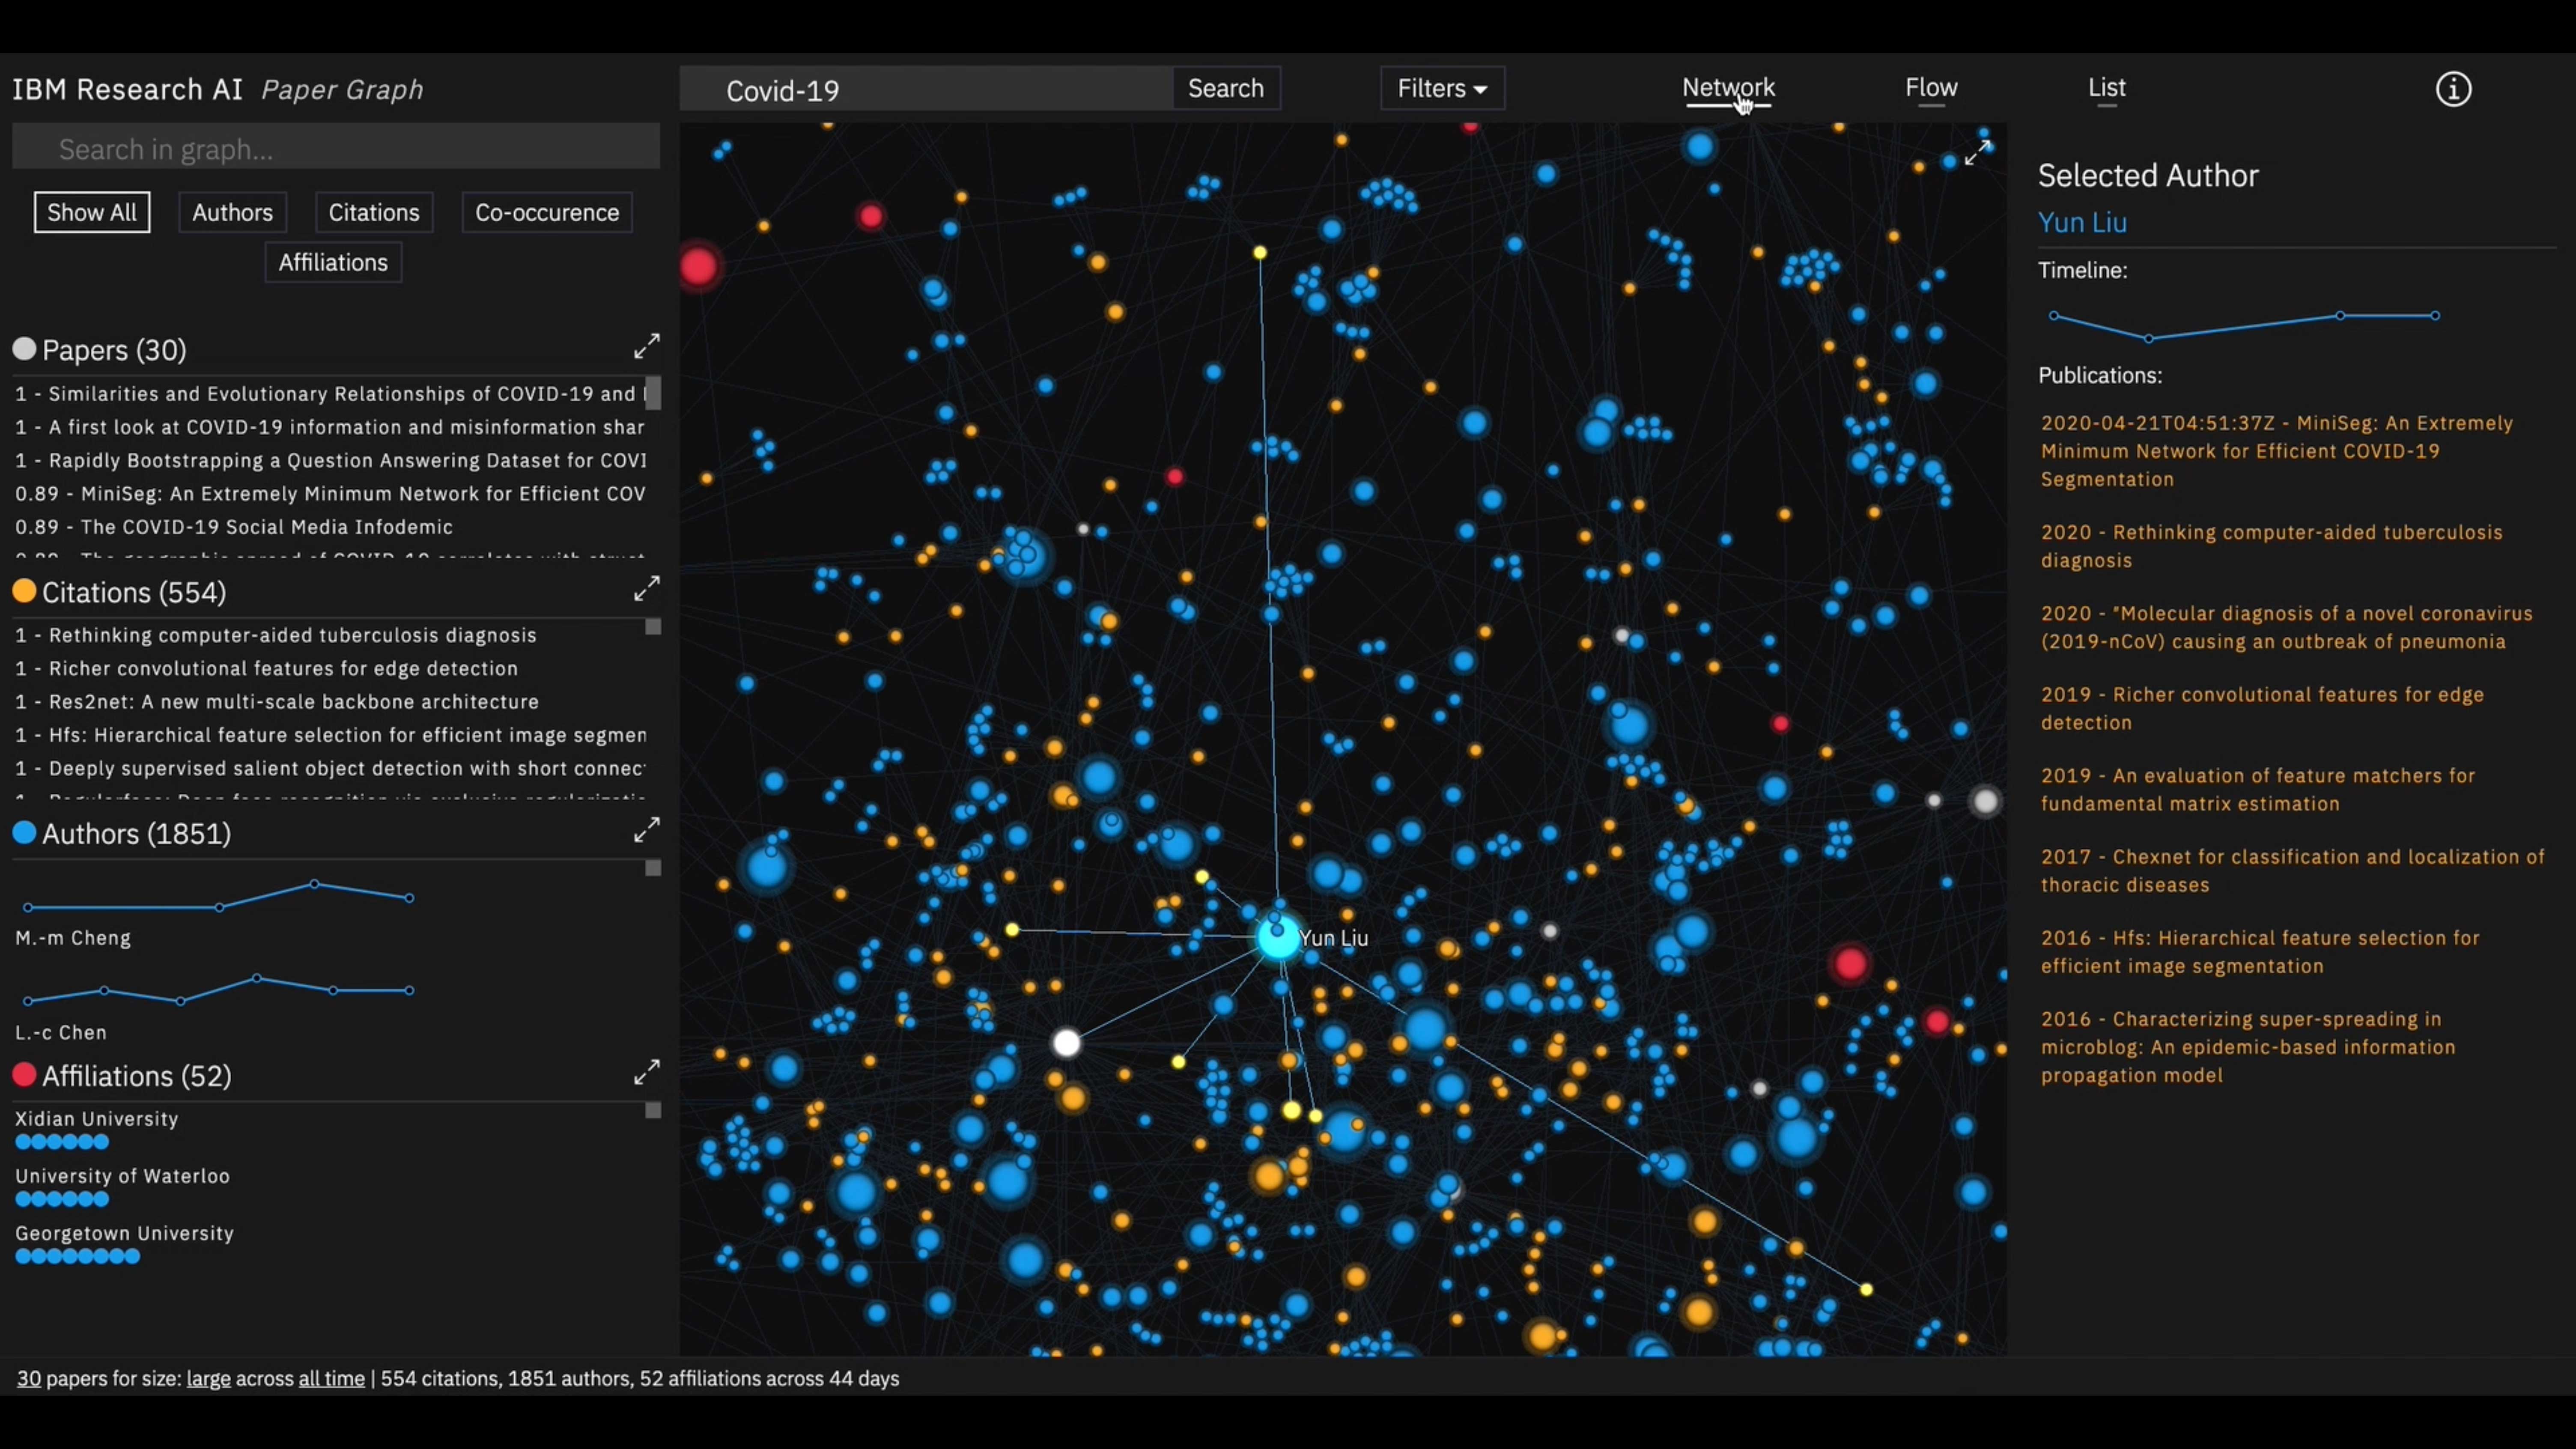
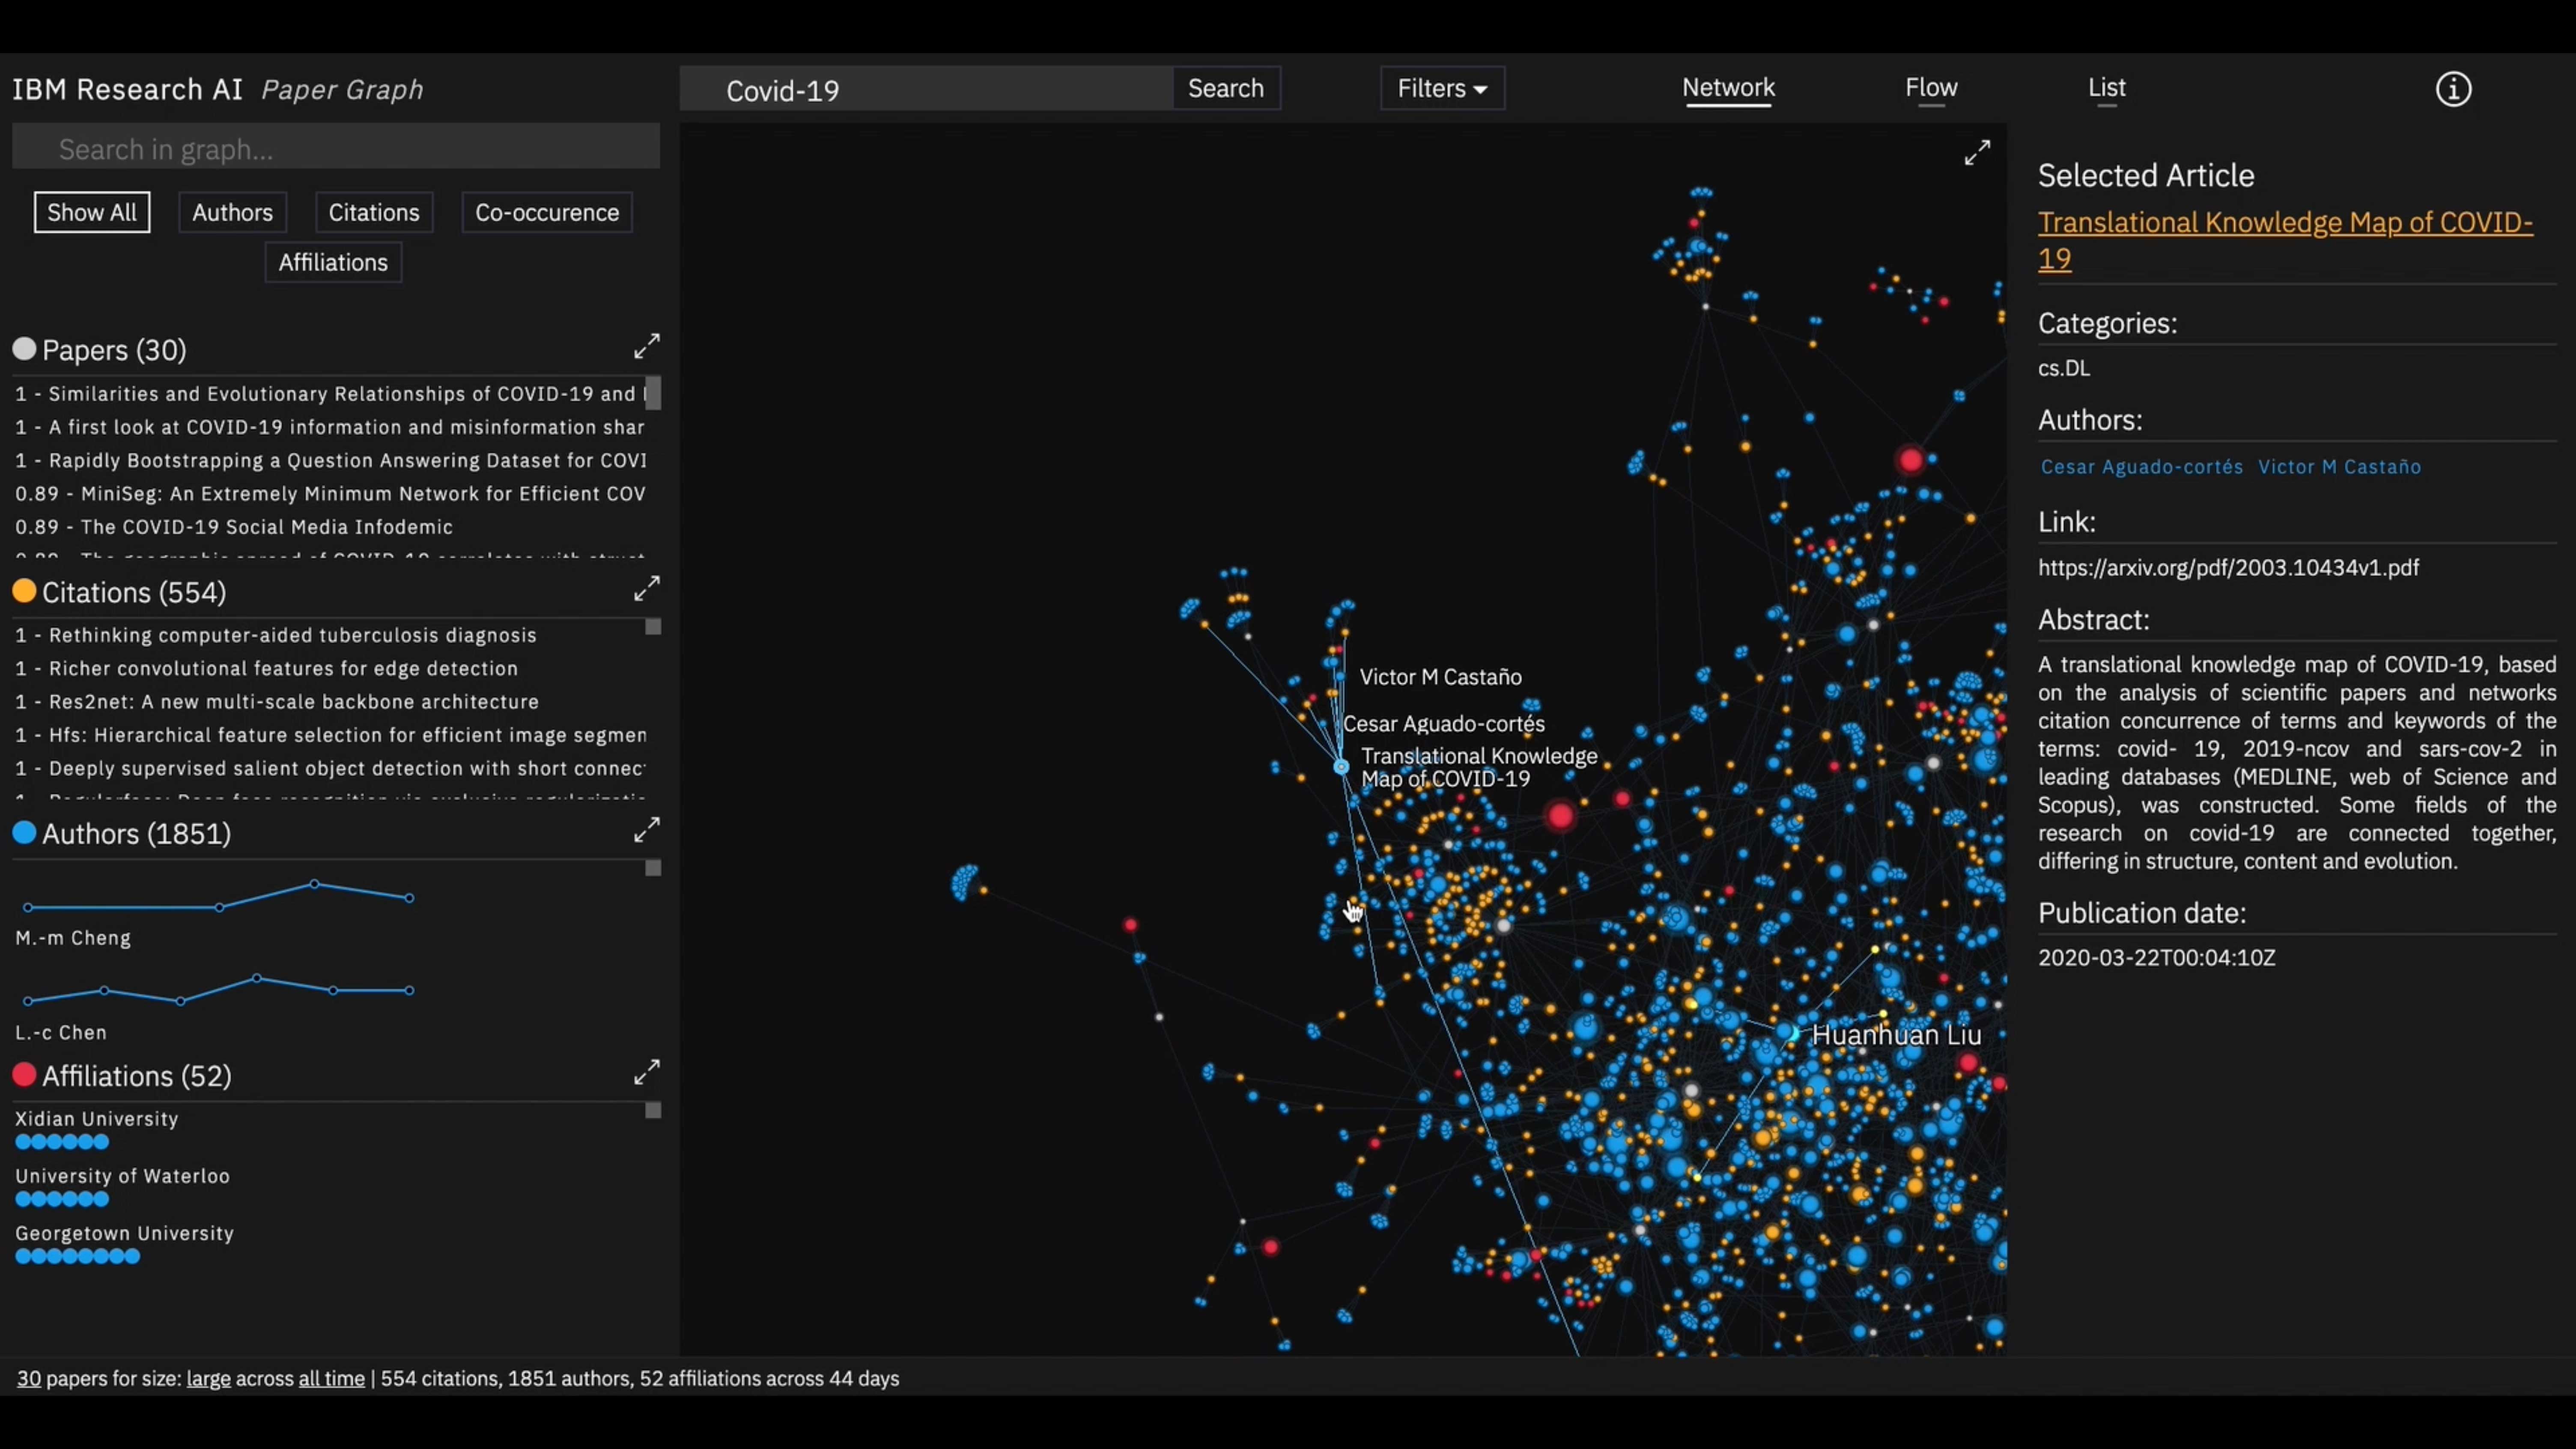
Multiple Perspectives
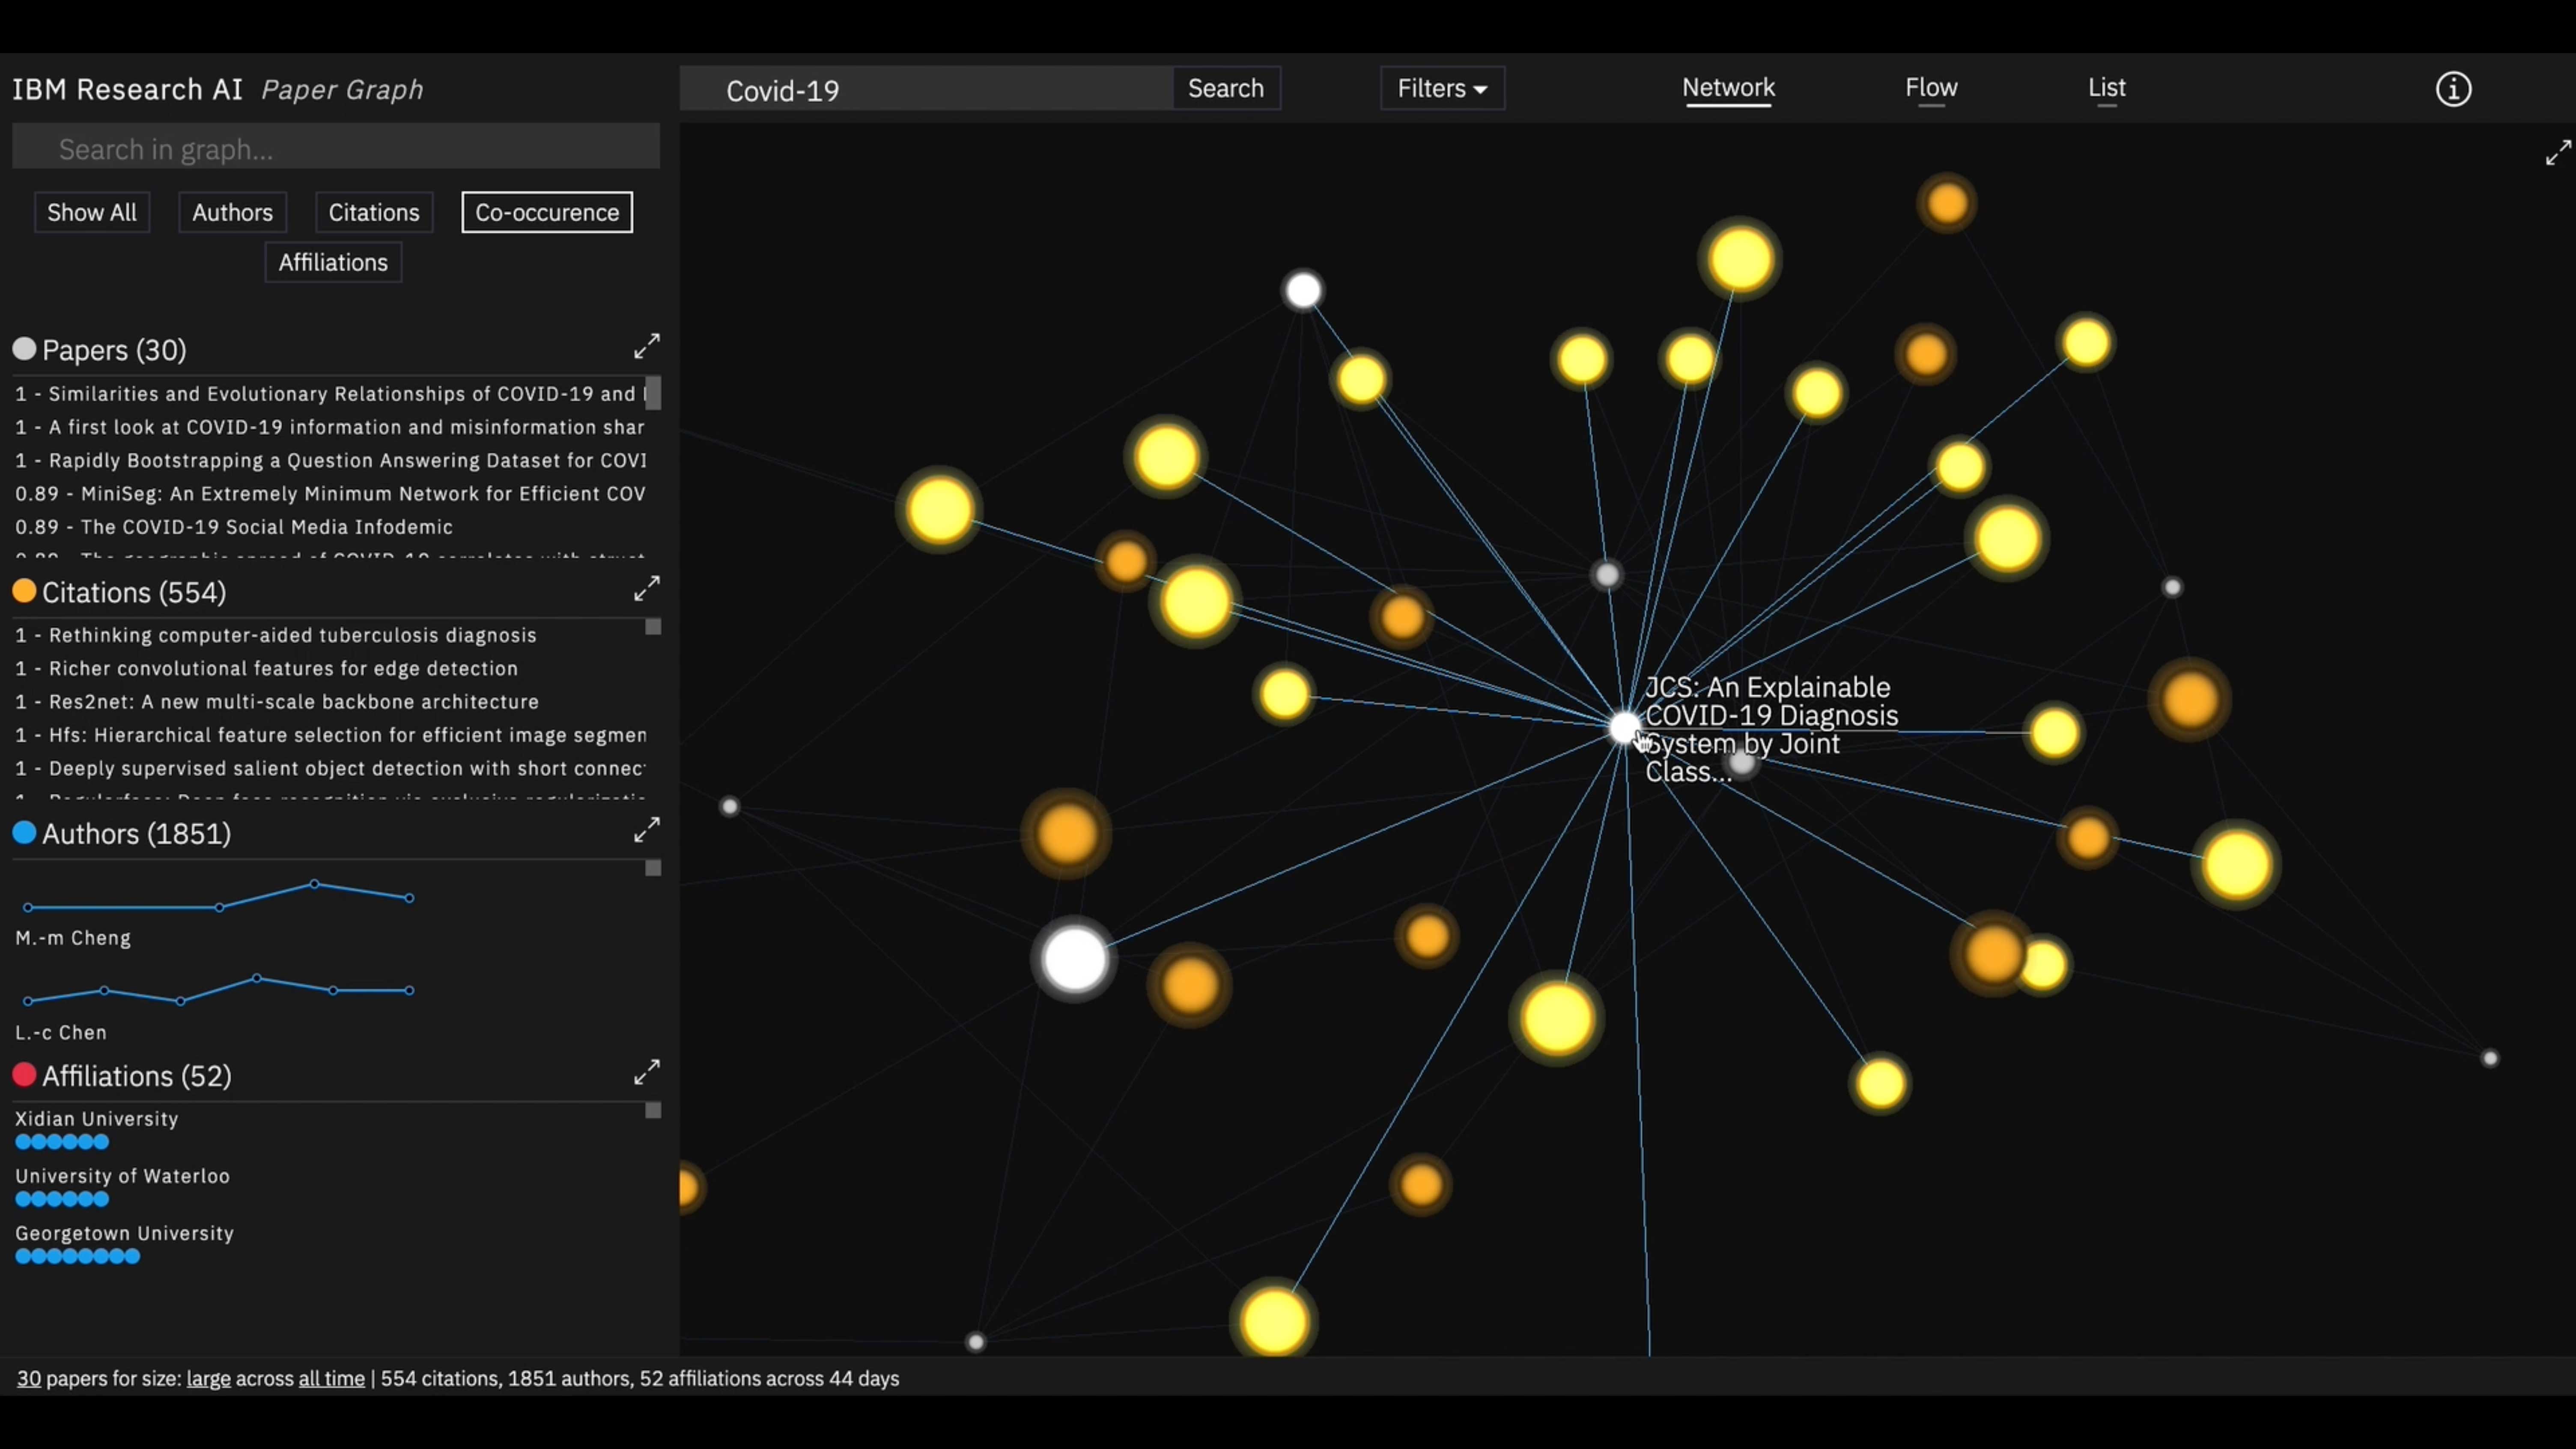
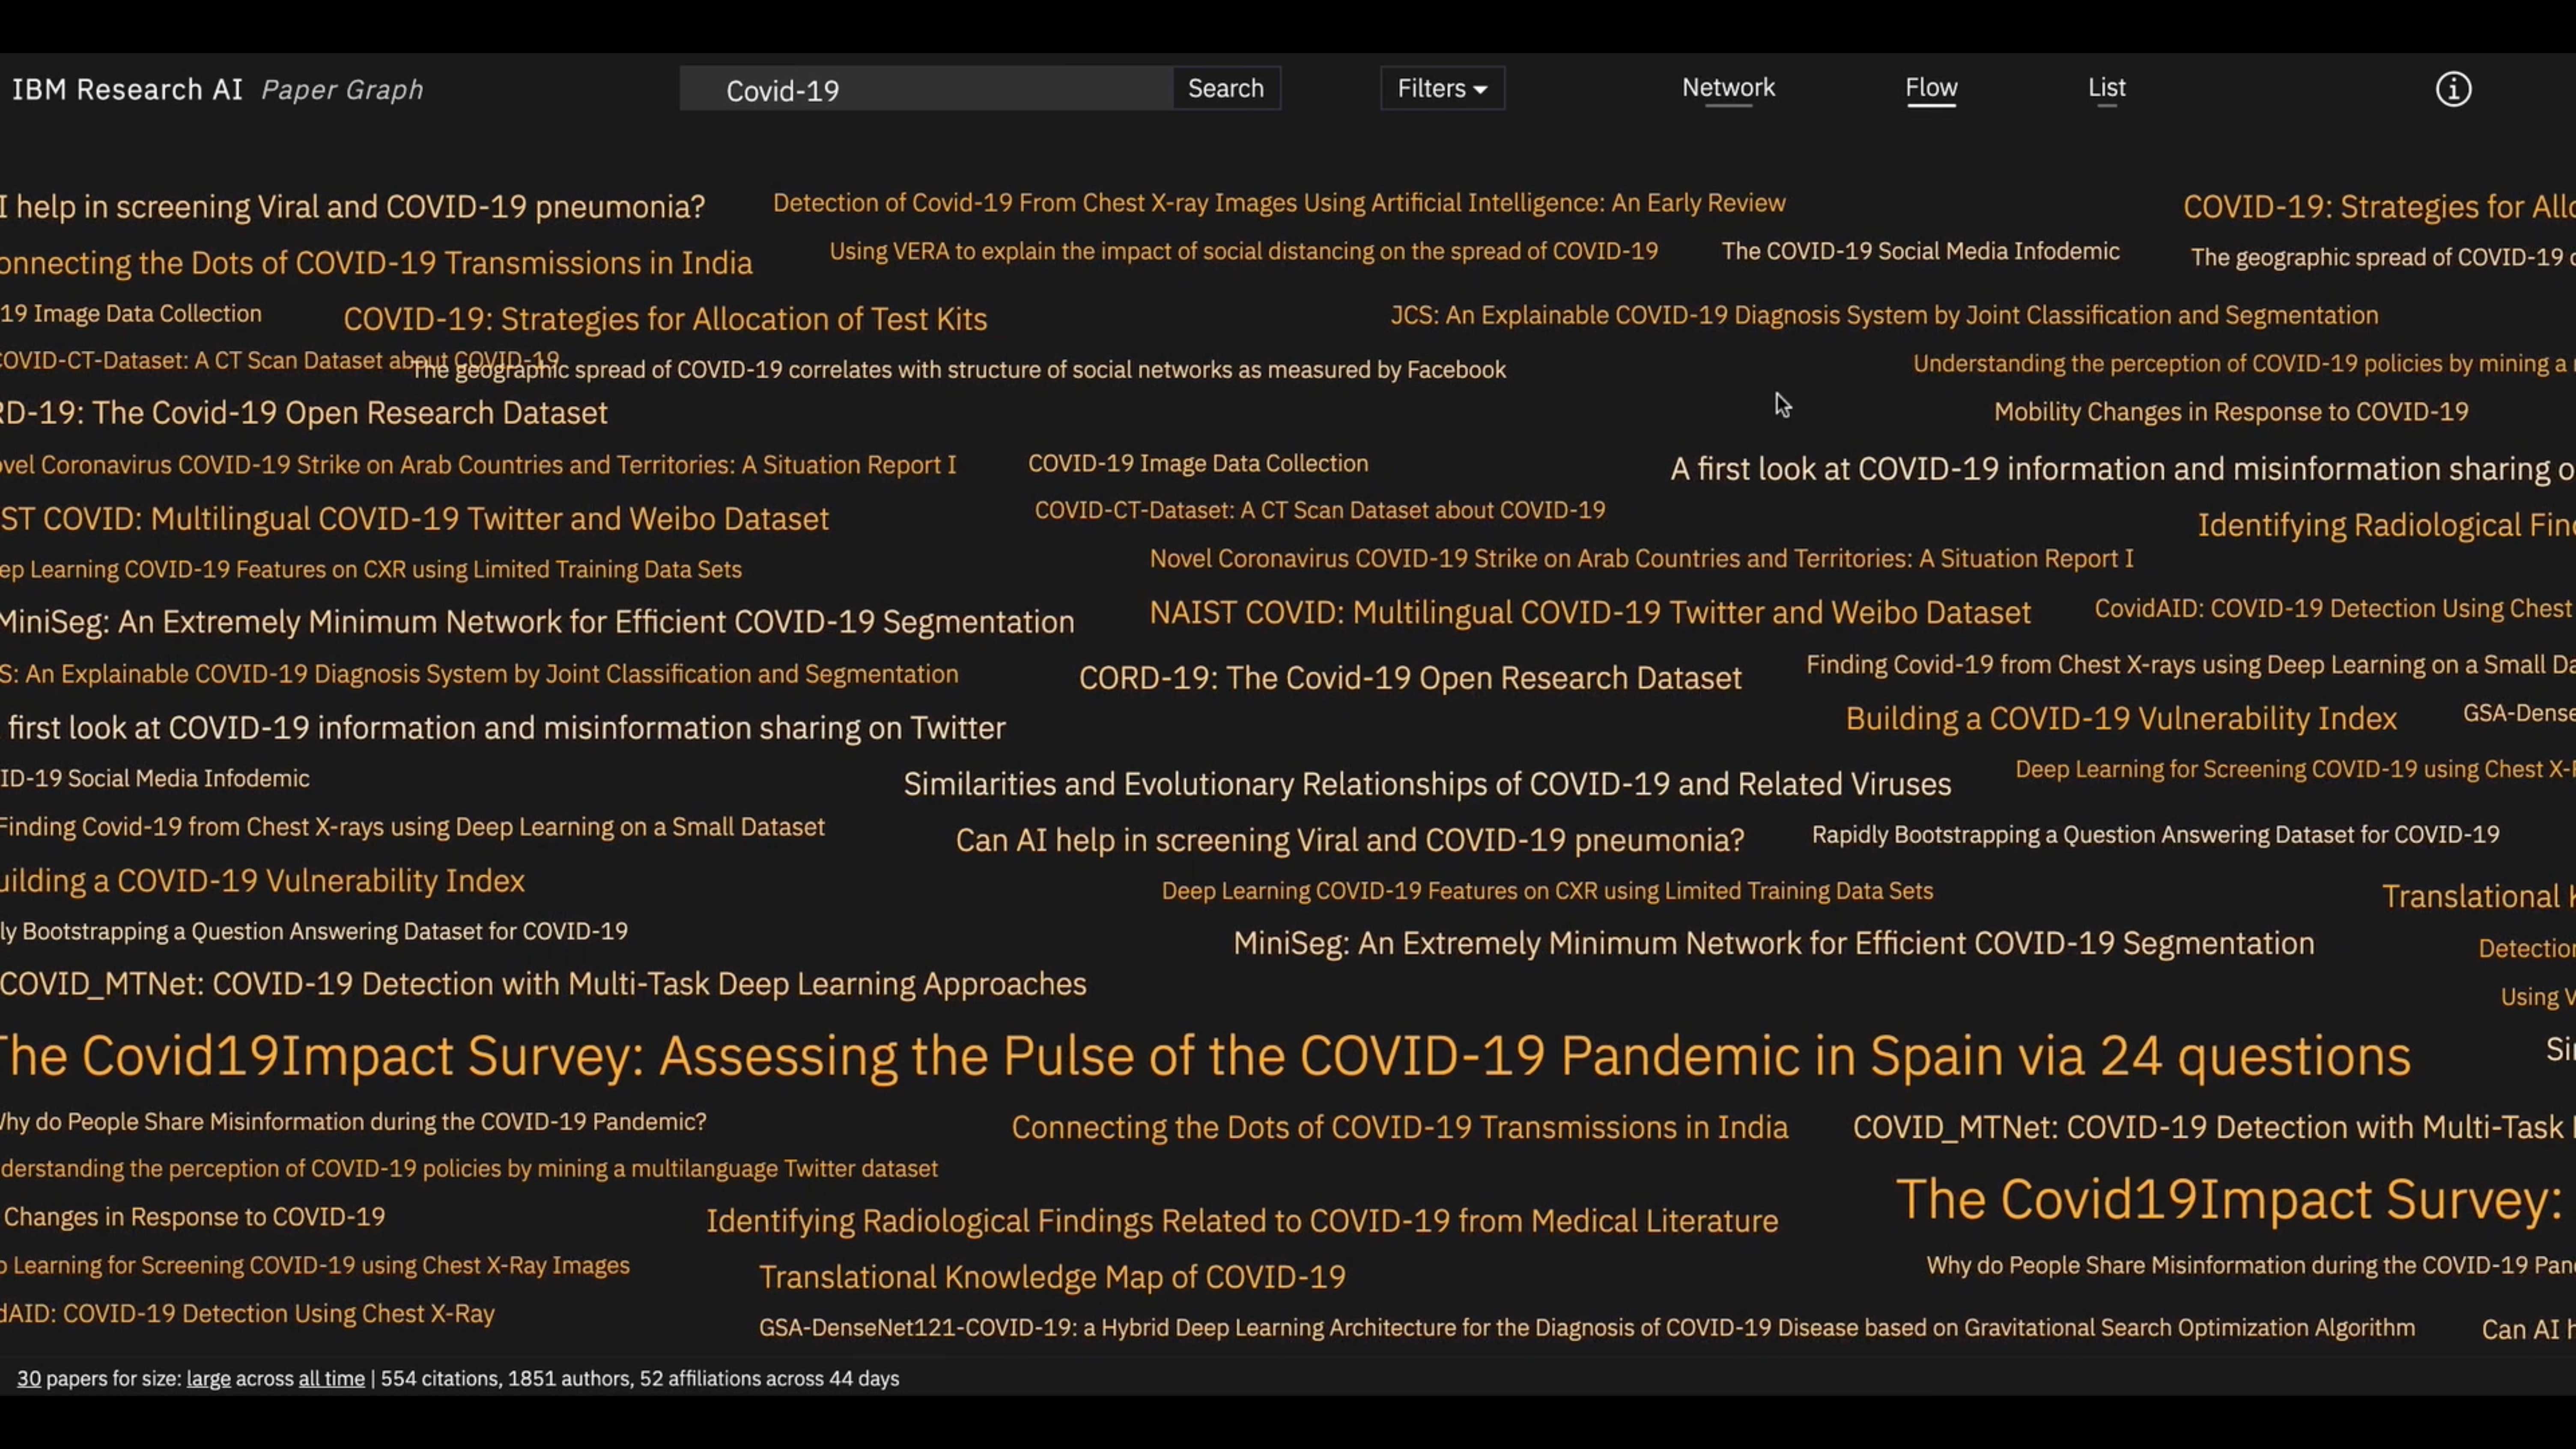
Paper Graph offers multiple visualization modes to explore research from different angles. Users can switch between citation networks, author collaborations, co-occurrence patterns, and knowledge flow views, each revealing different aspects of how scientific ideas develop and spread.
How It Works
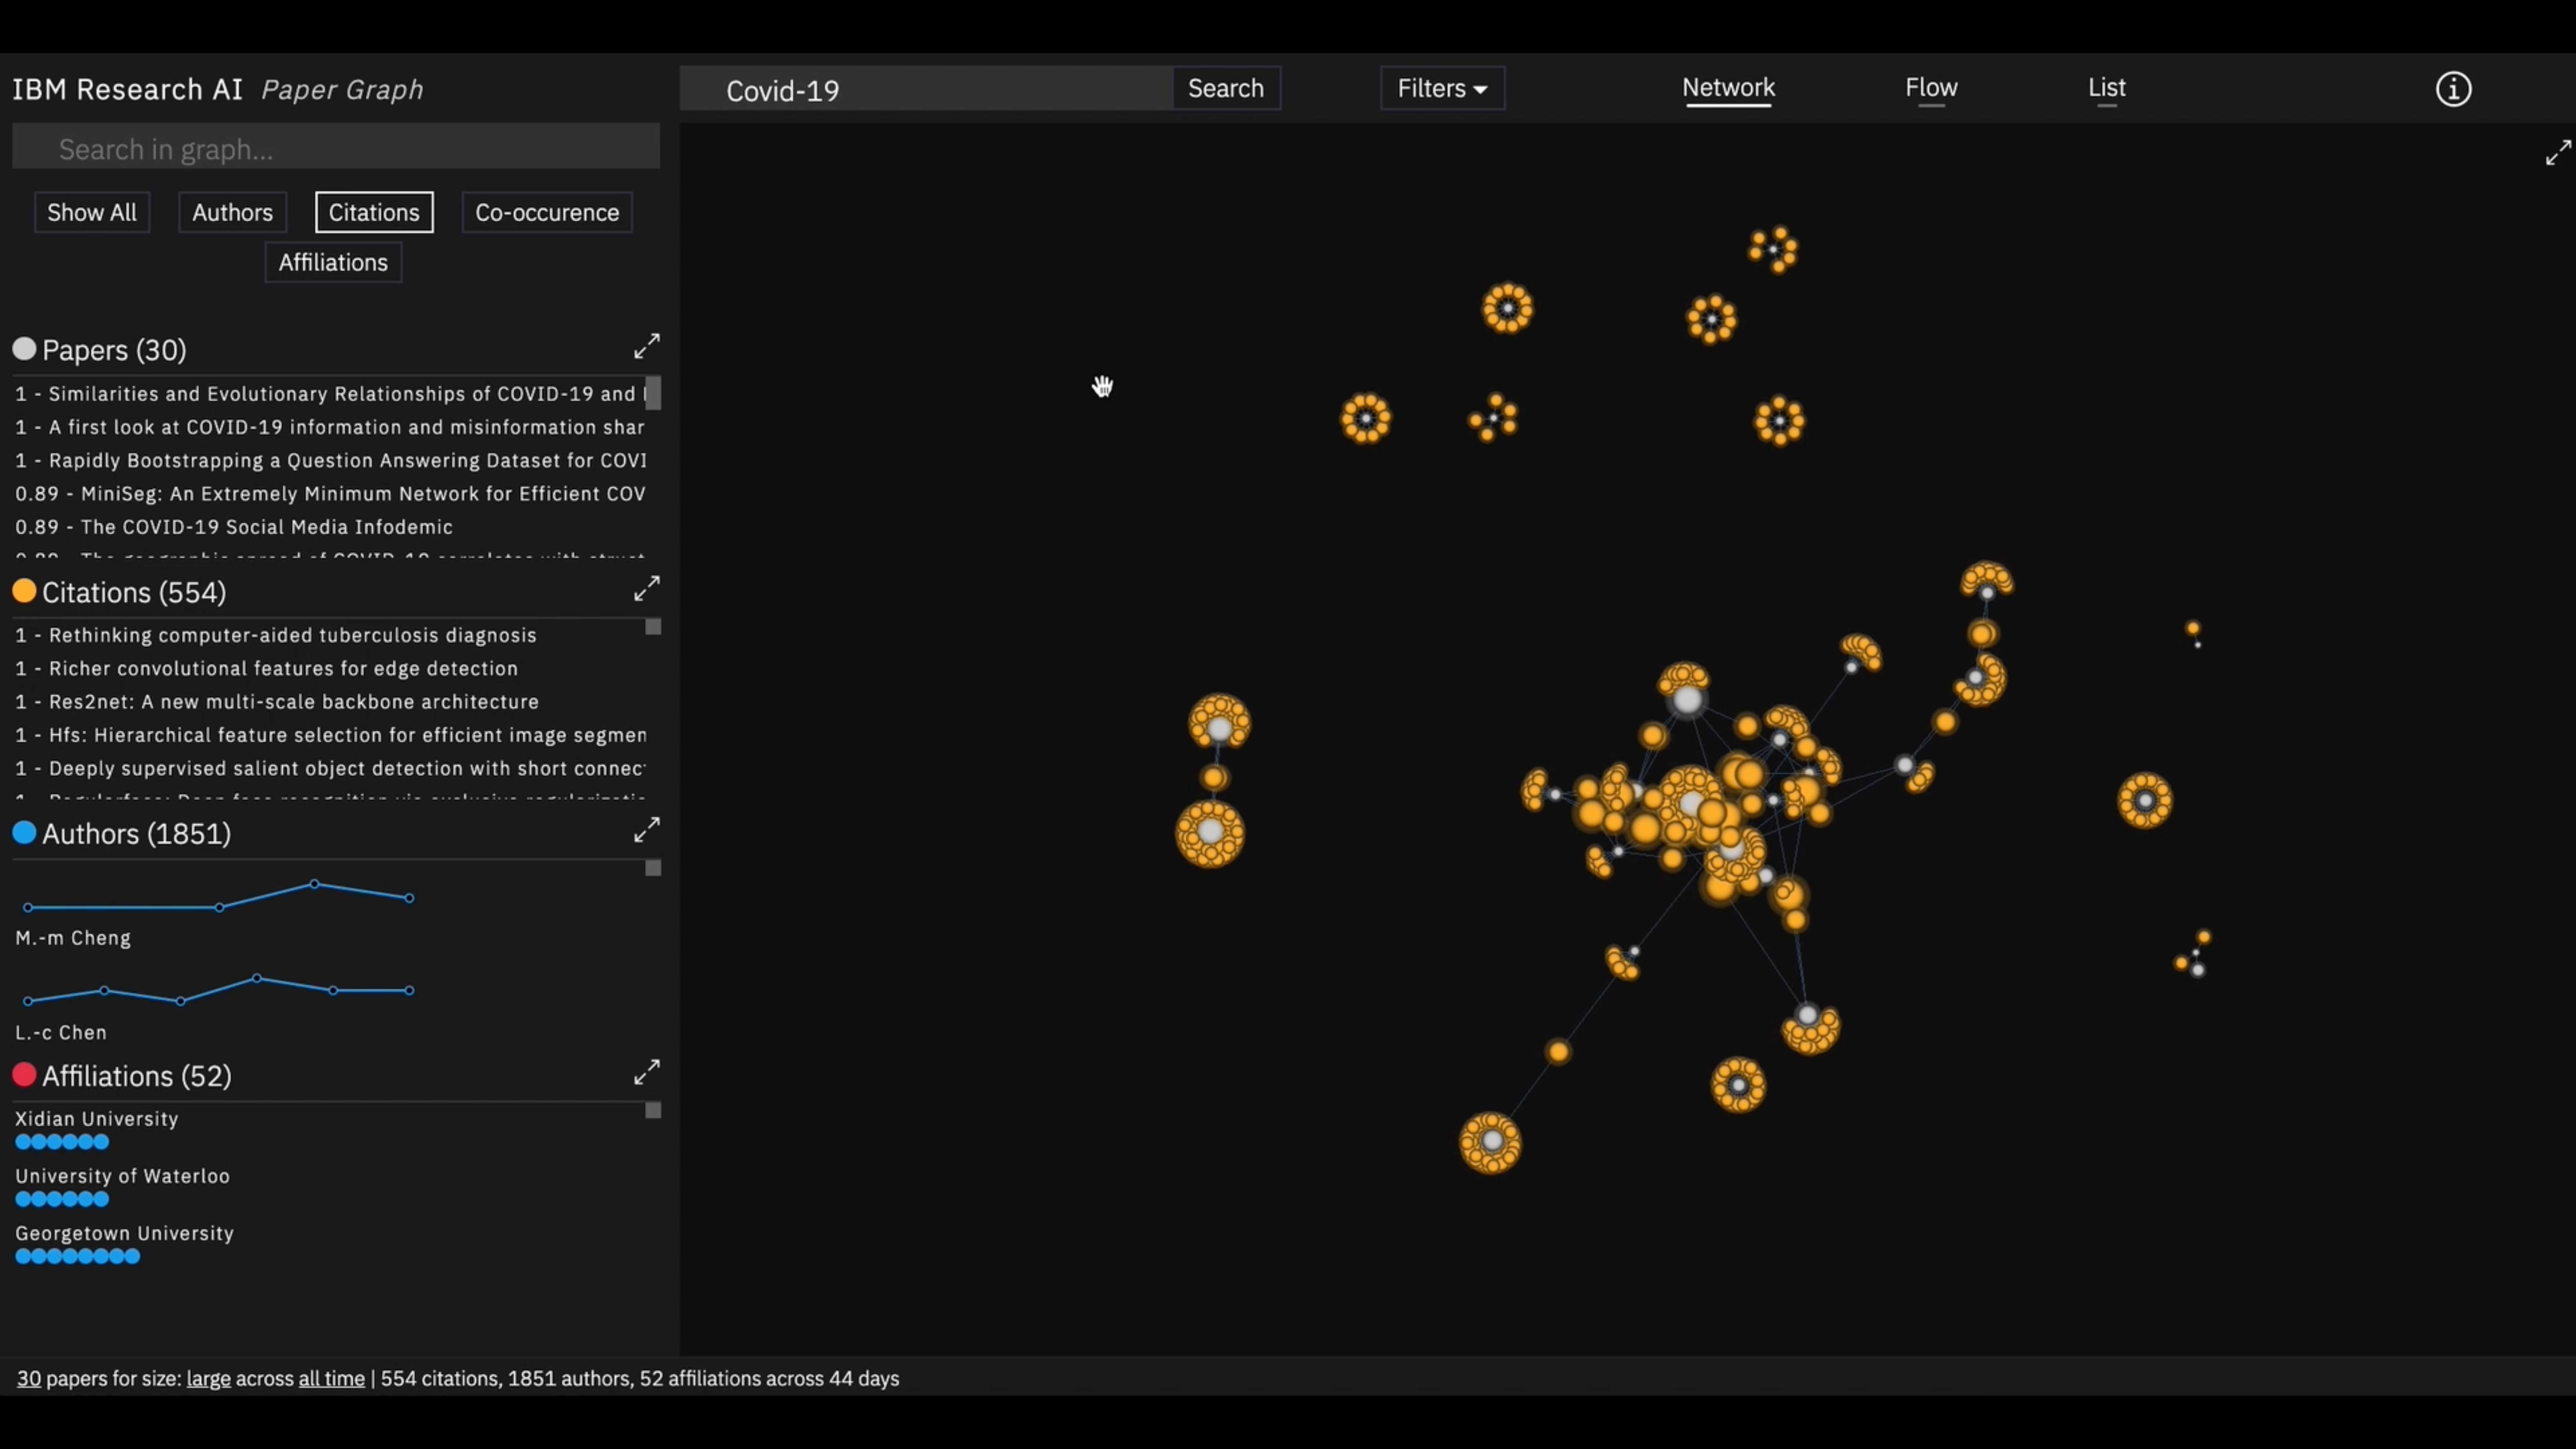
Citation Networks
Explore how papers cite each other, revealing intellectual lineage
Author Connections
Discover collaboration patterns between researchers
Co-occurrence
Find papers that appear together in reference lists
Knowledge Flow
See how ideas spread across institutions and fields
Impact
Rather than reading papers in isolation, researchers can now see how their work fits into the broader landscape of scientific inquiry. By making the invisible connections between ideas visible, Paper Graph enables serendipitous discovery and helps users find relevant work they might have otherwise missed.