The Rise of Partisanship
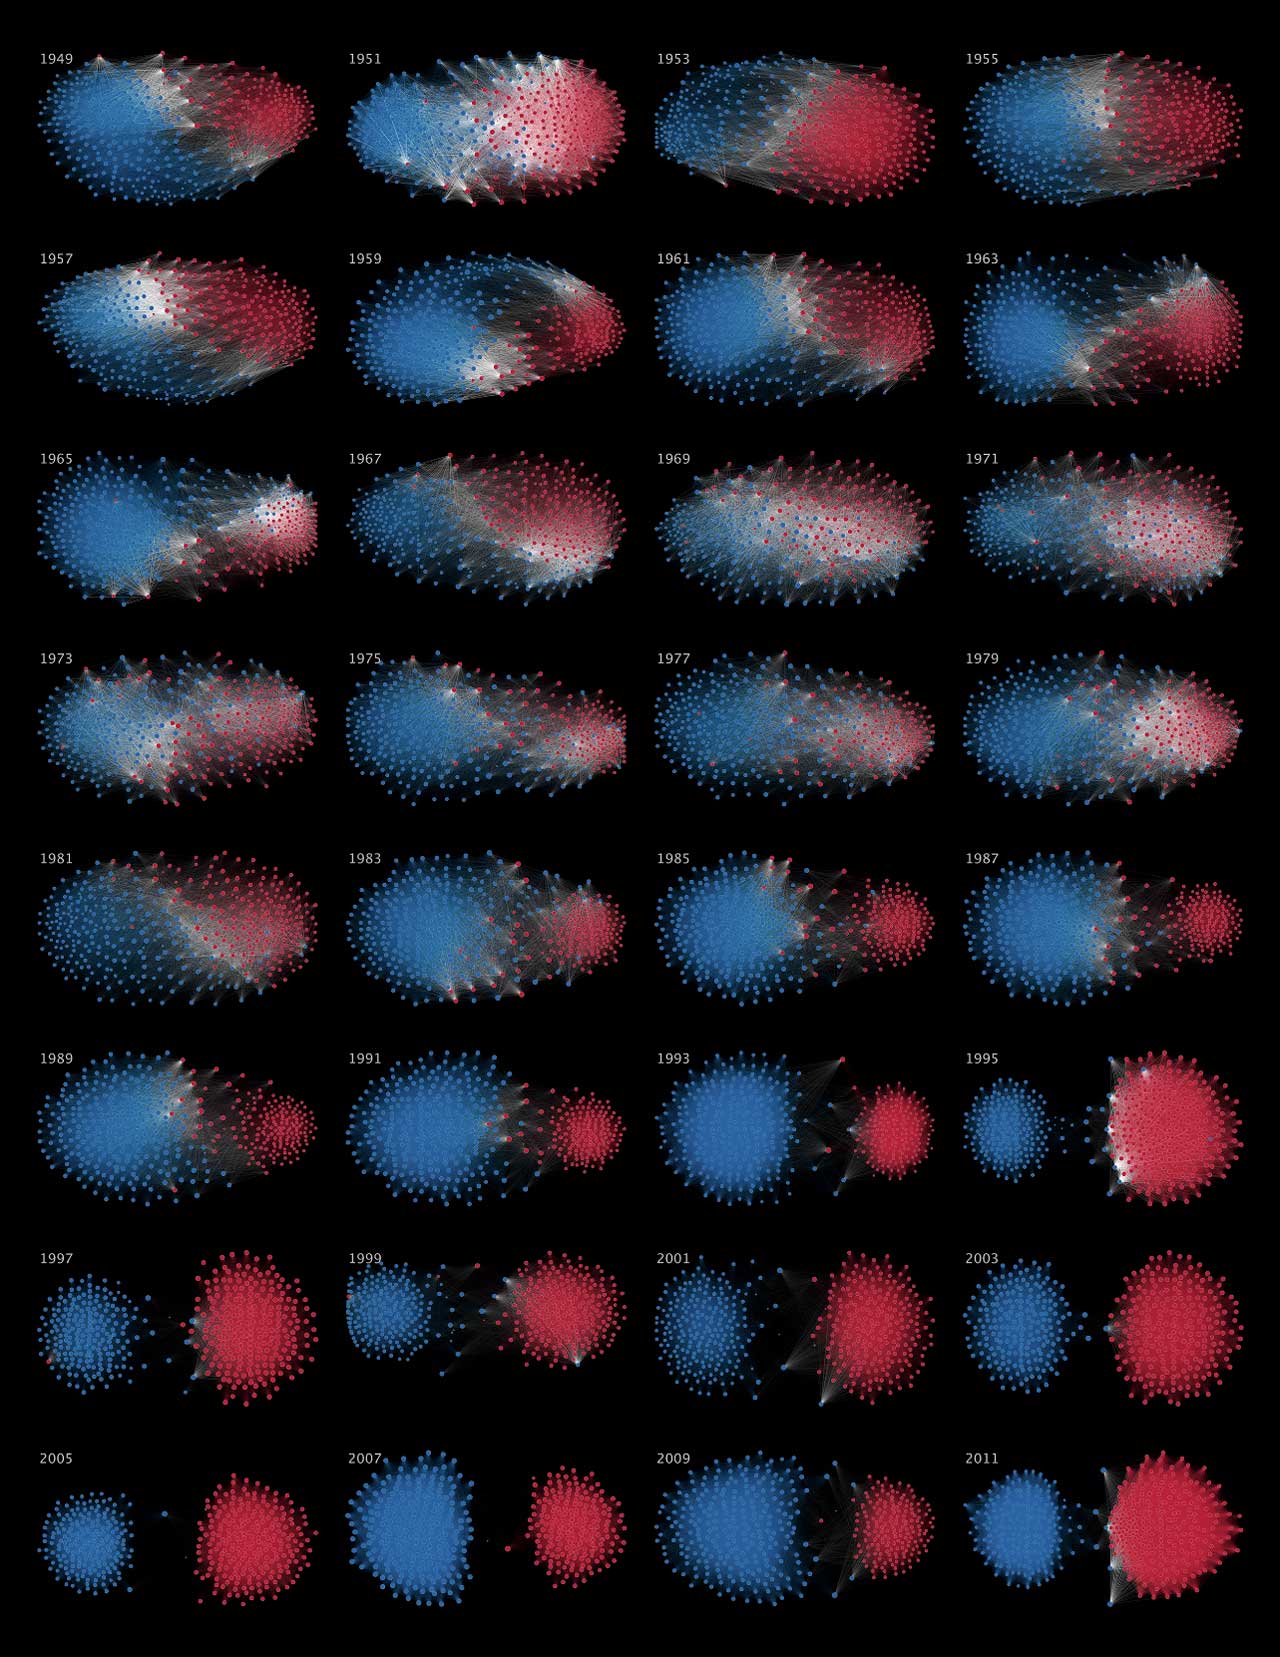
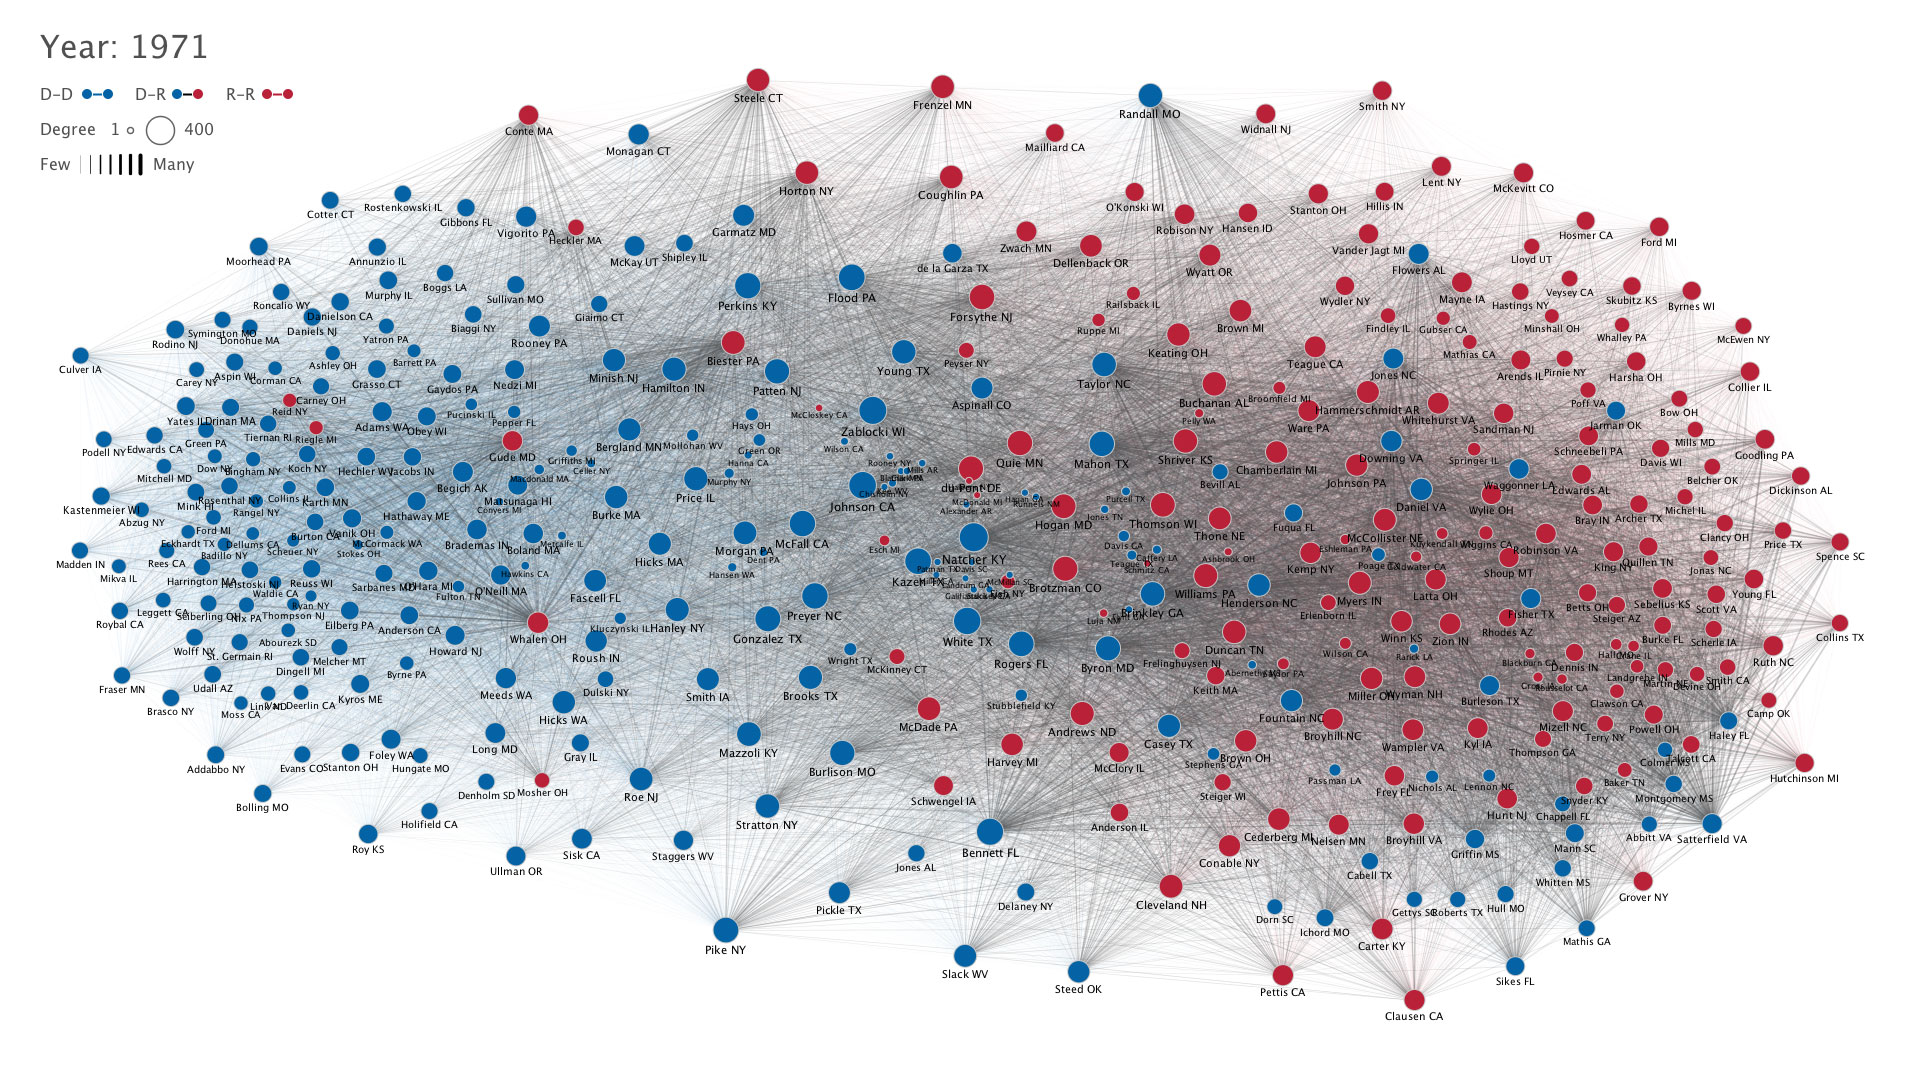
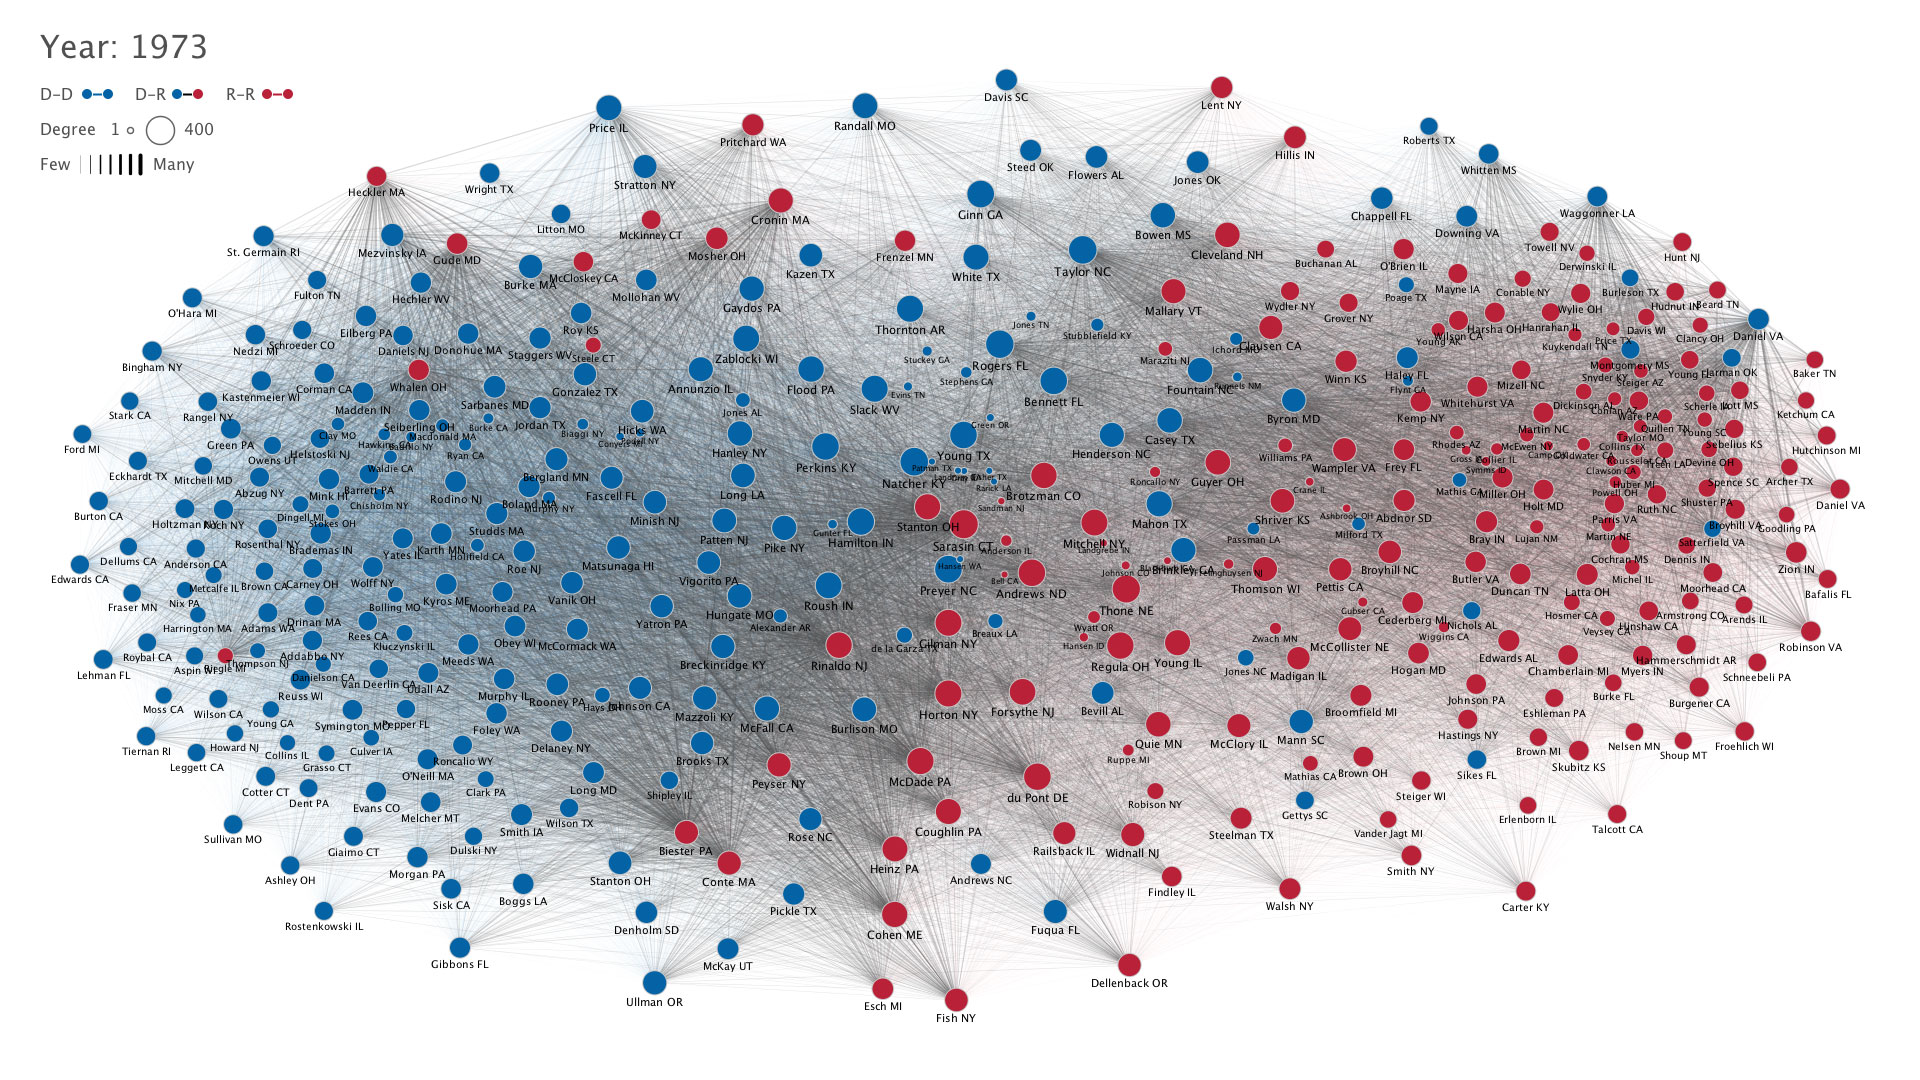
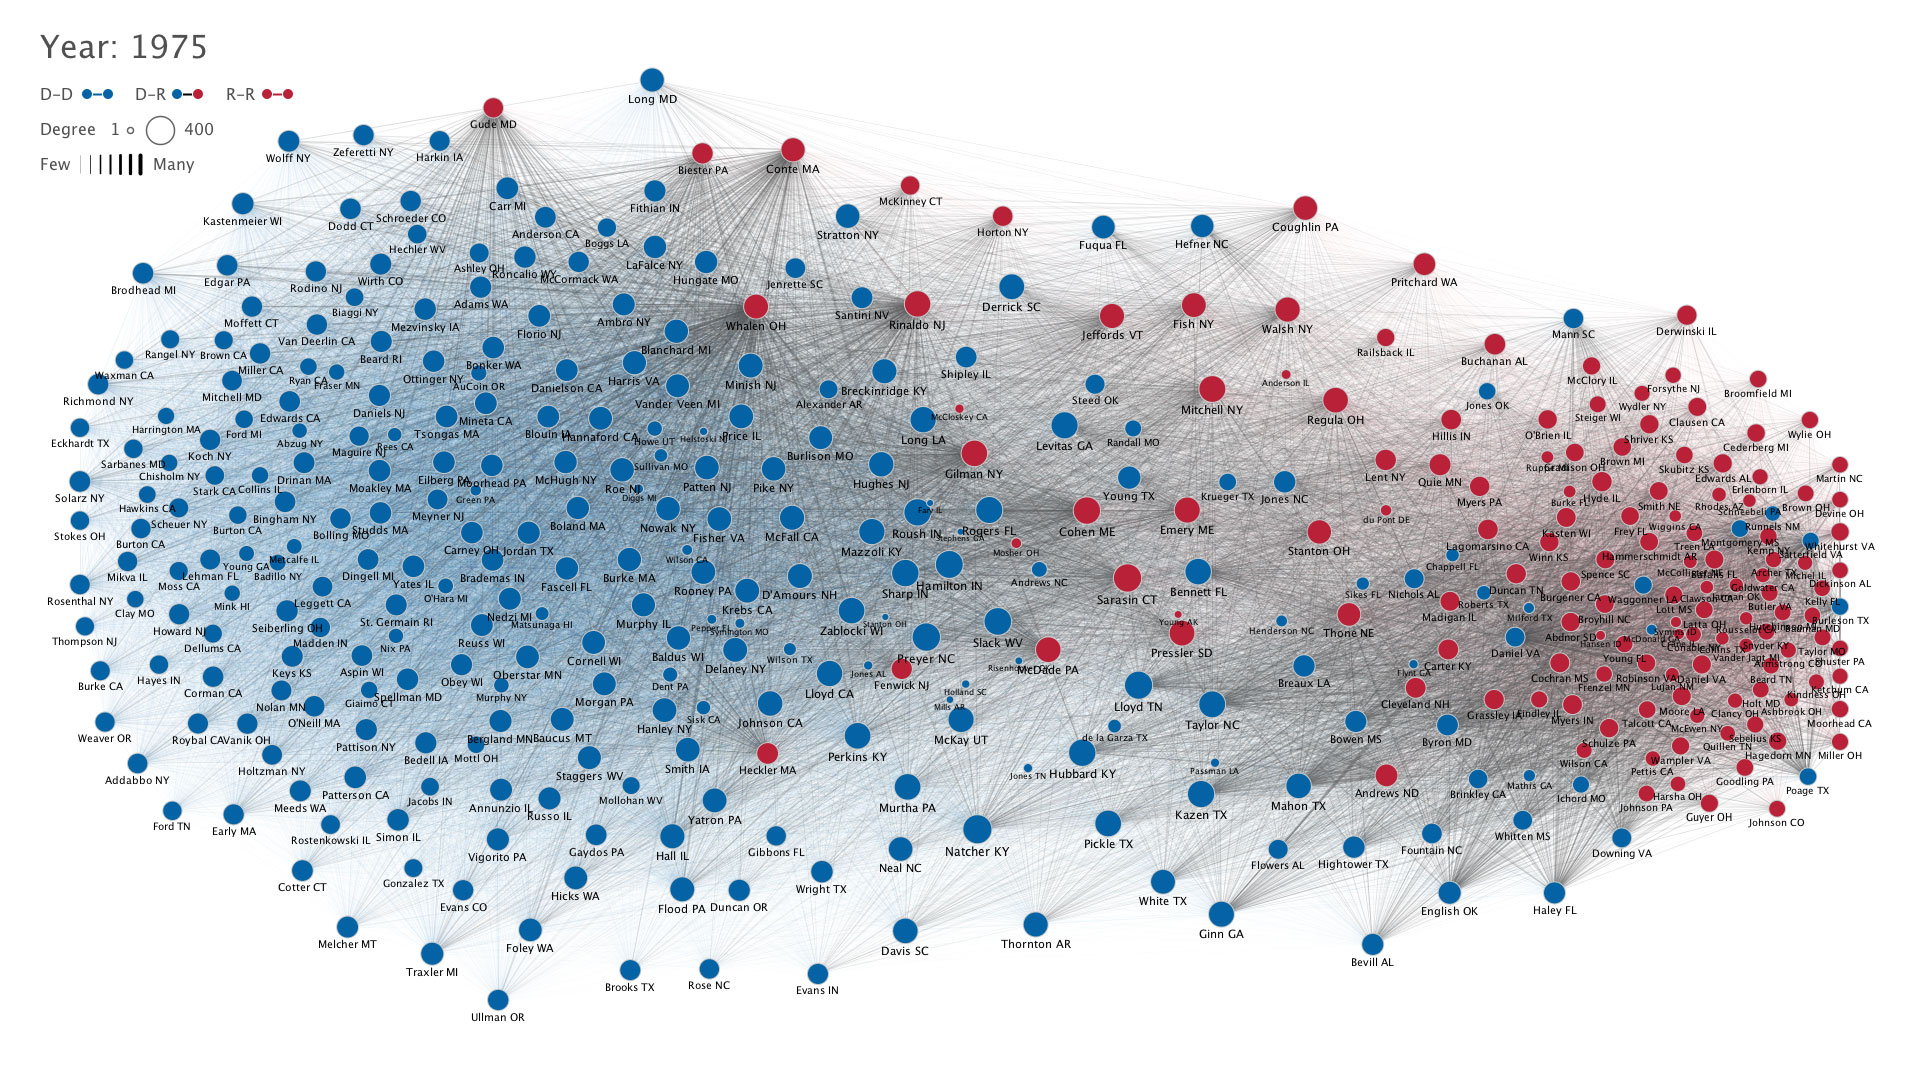
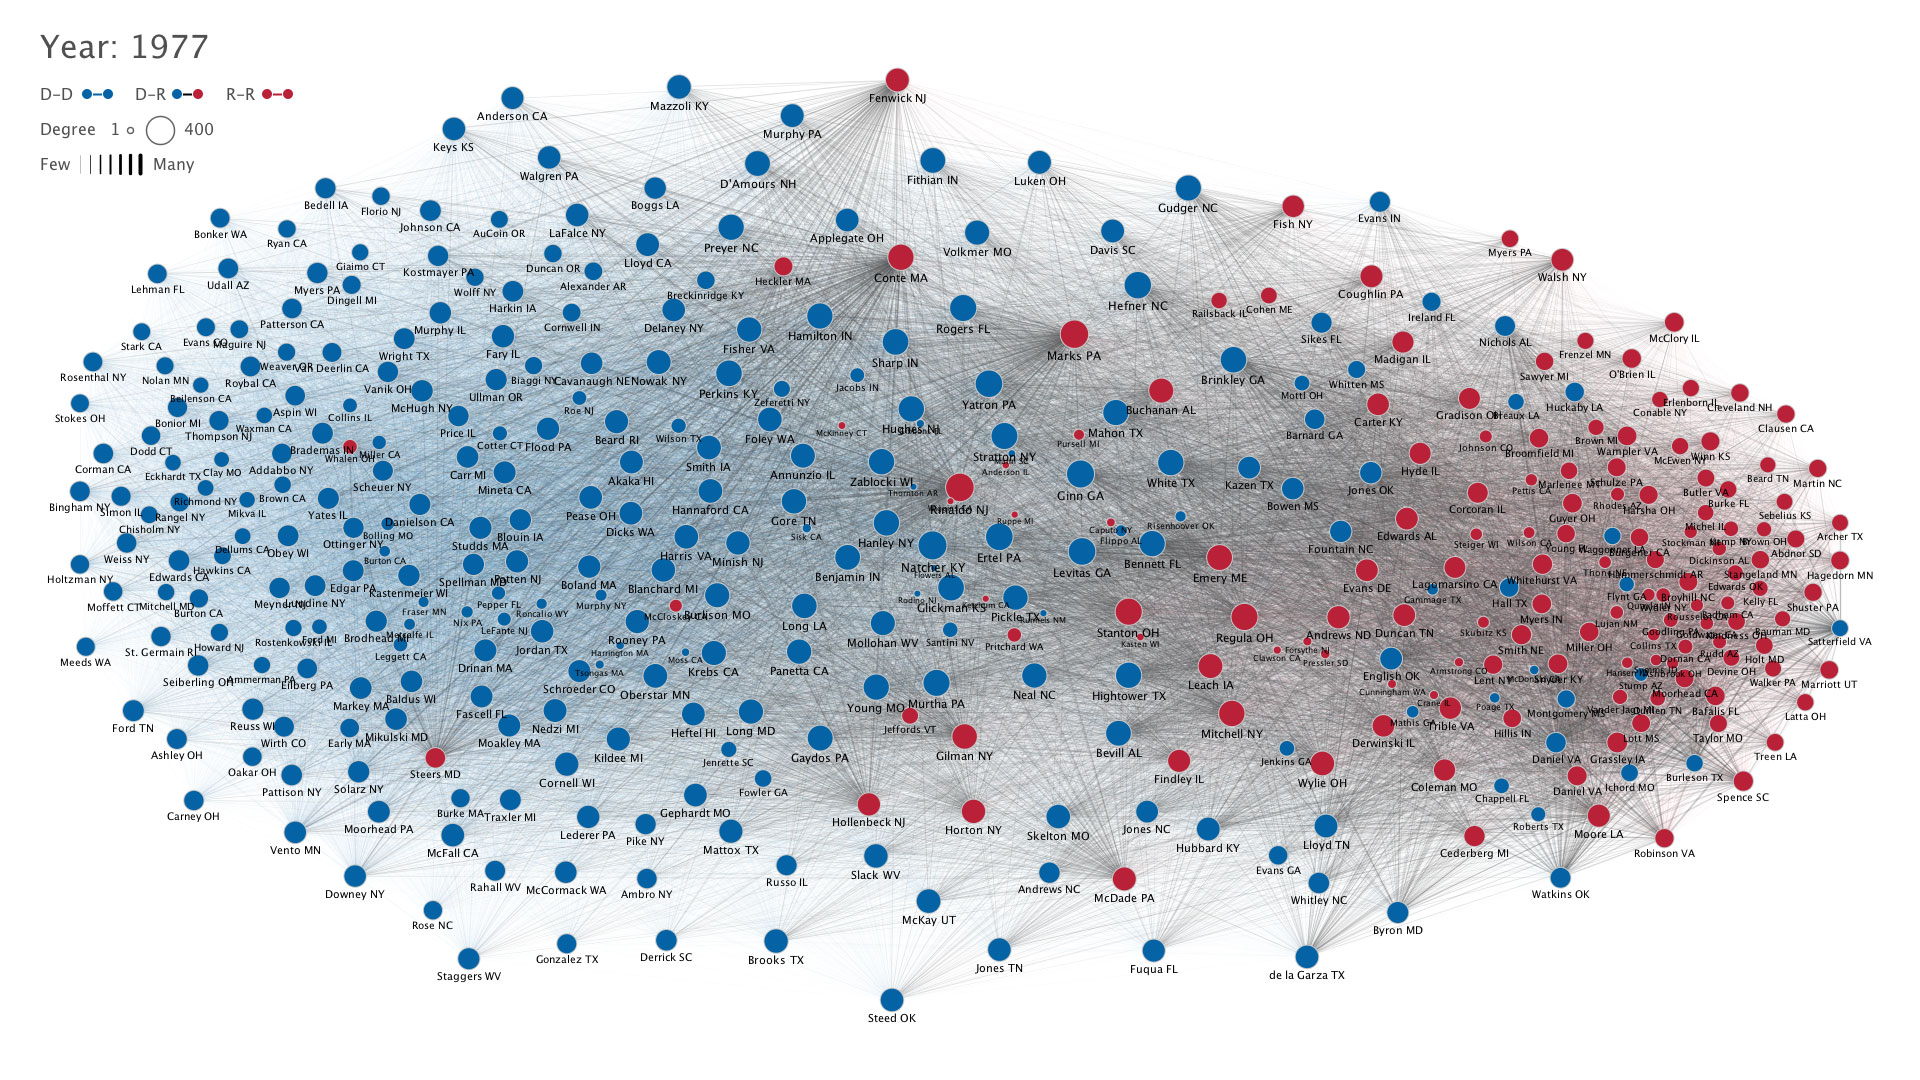
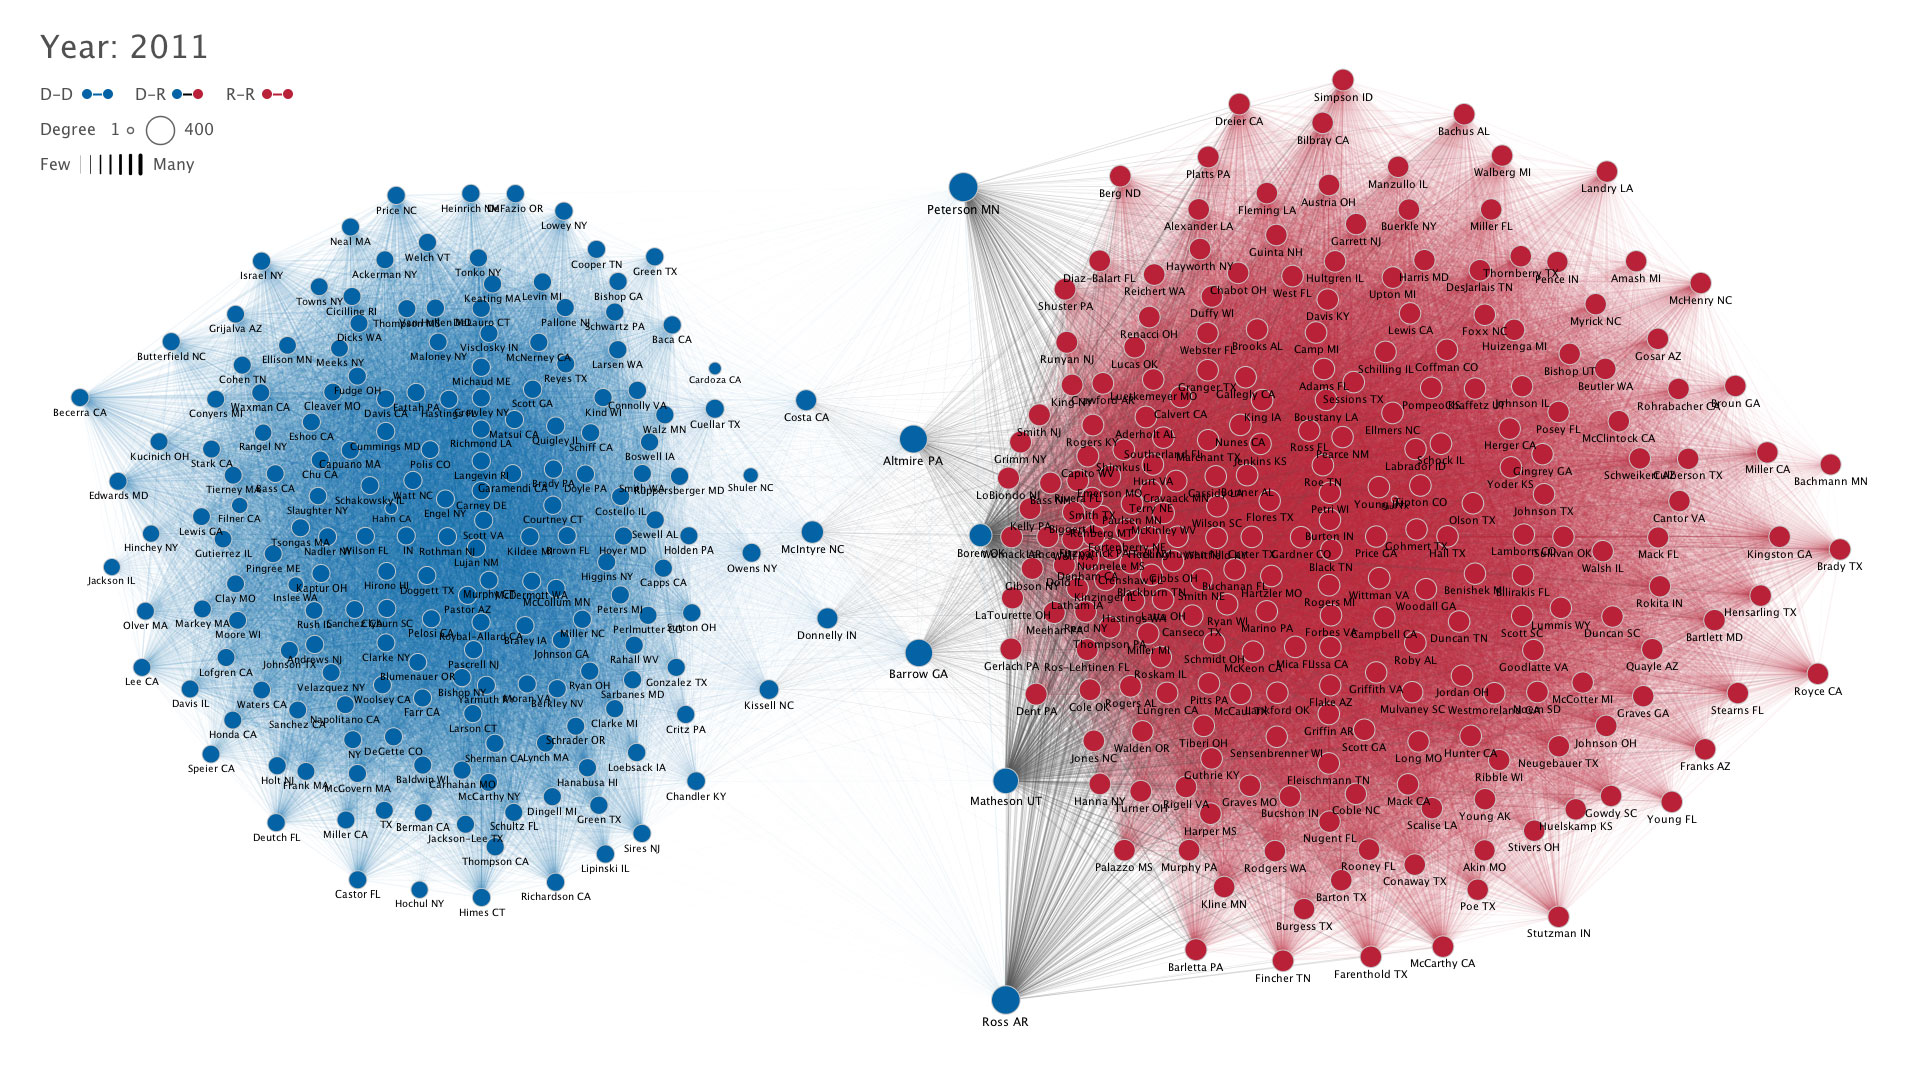
Network visualization of political polarization in the U.S. House of Representatives from 1949 to 2012
Summary
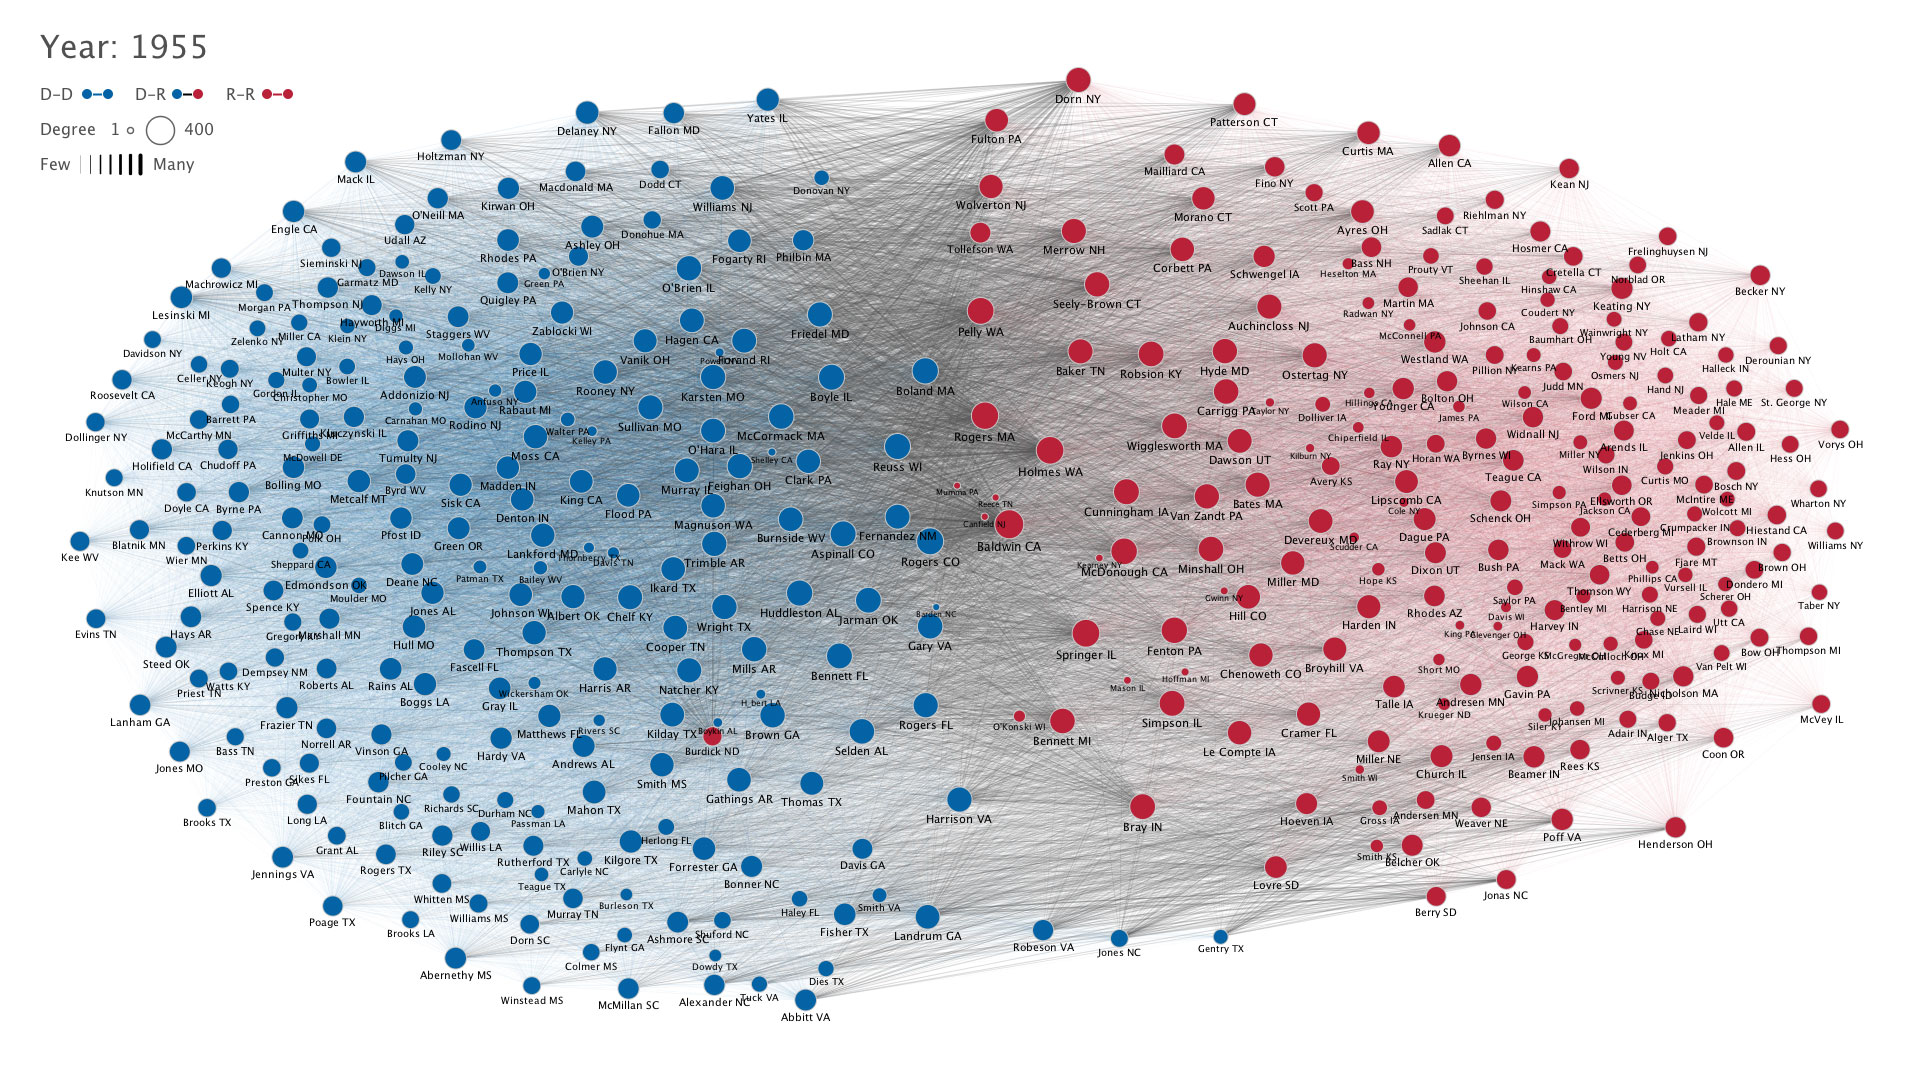
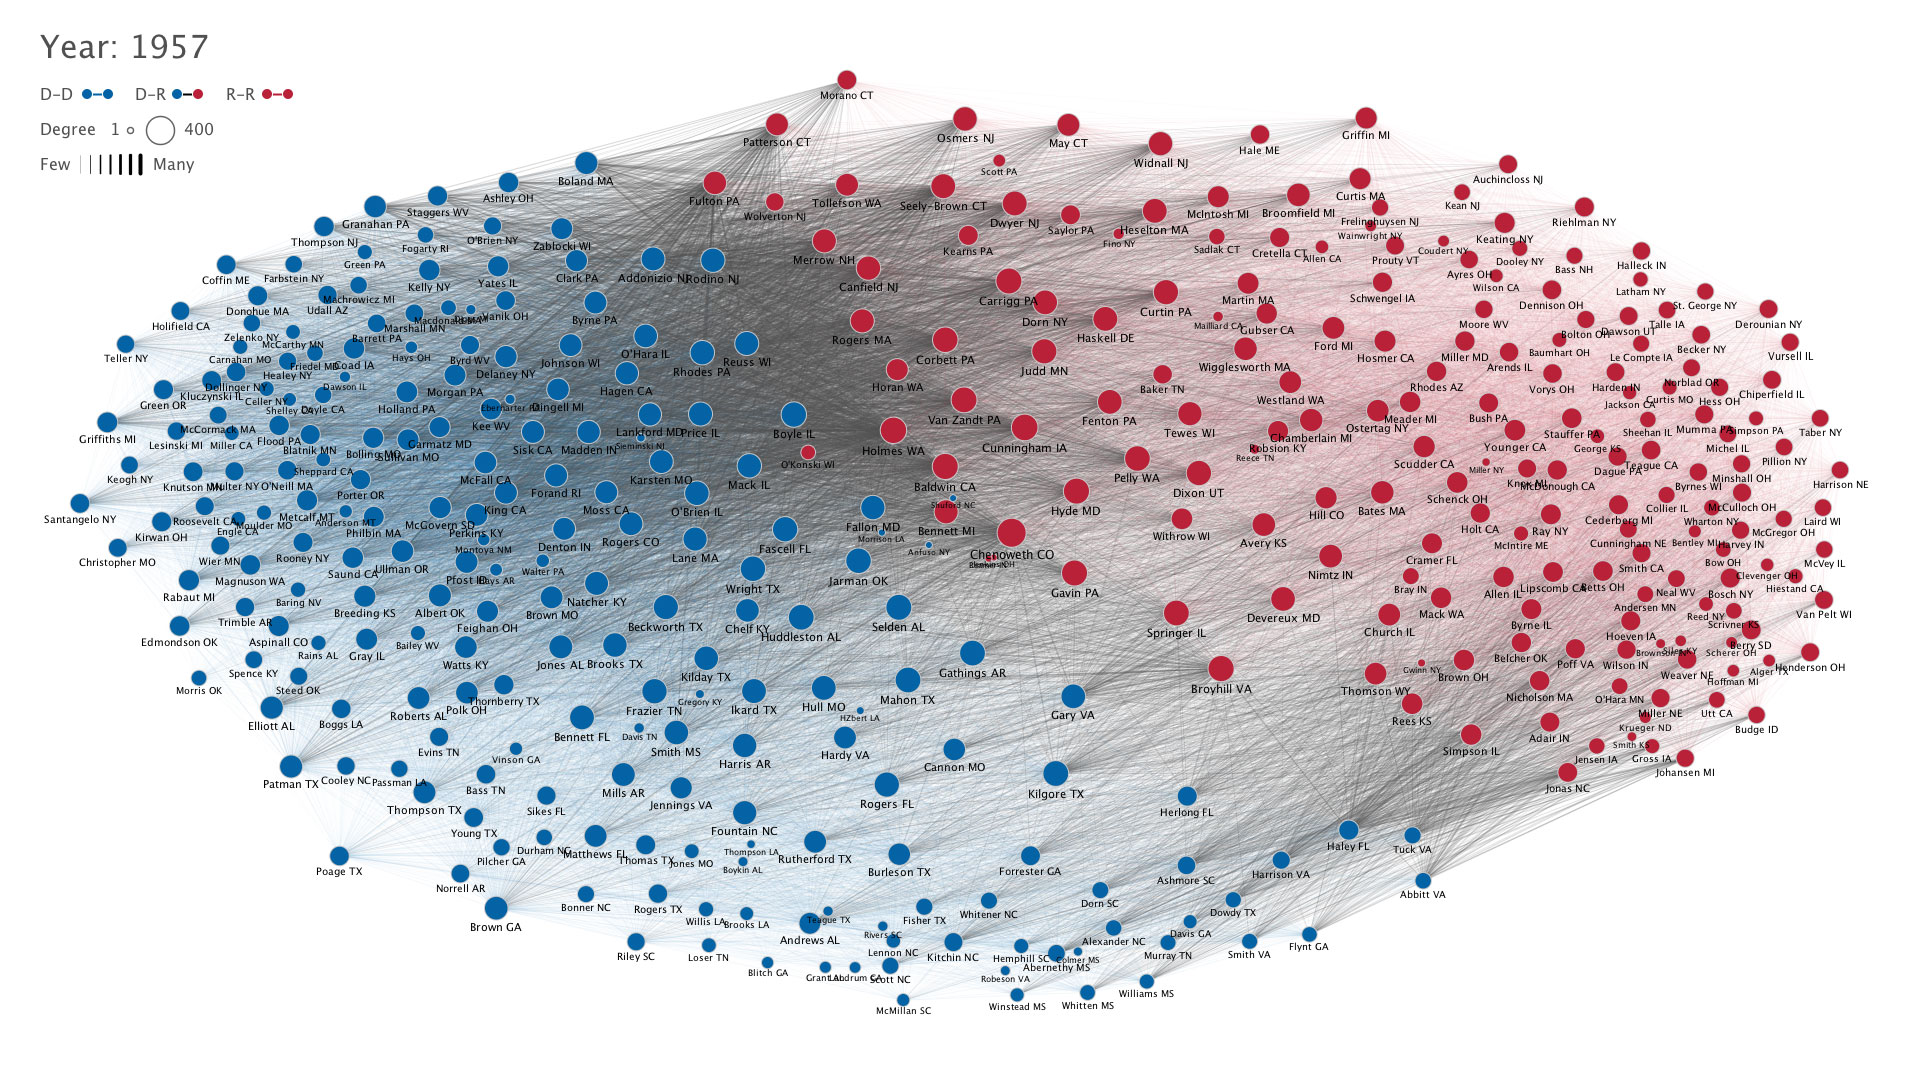
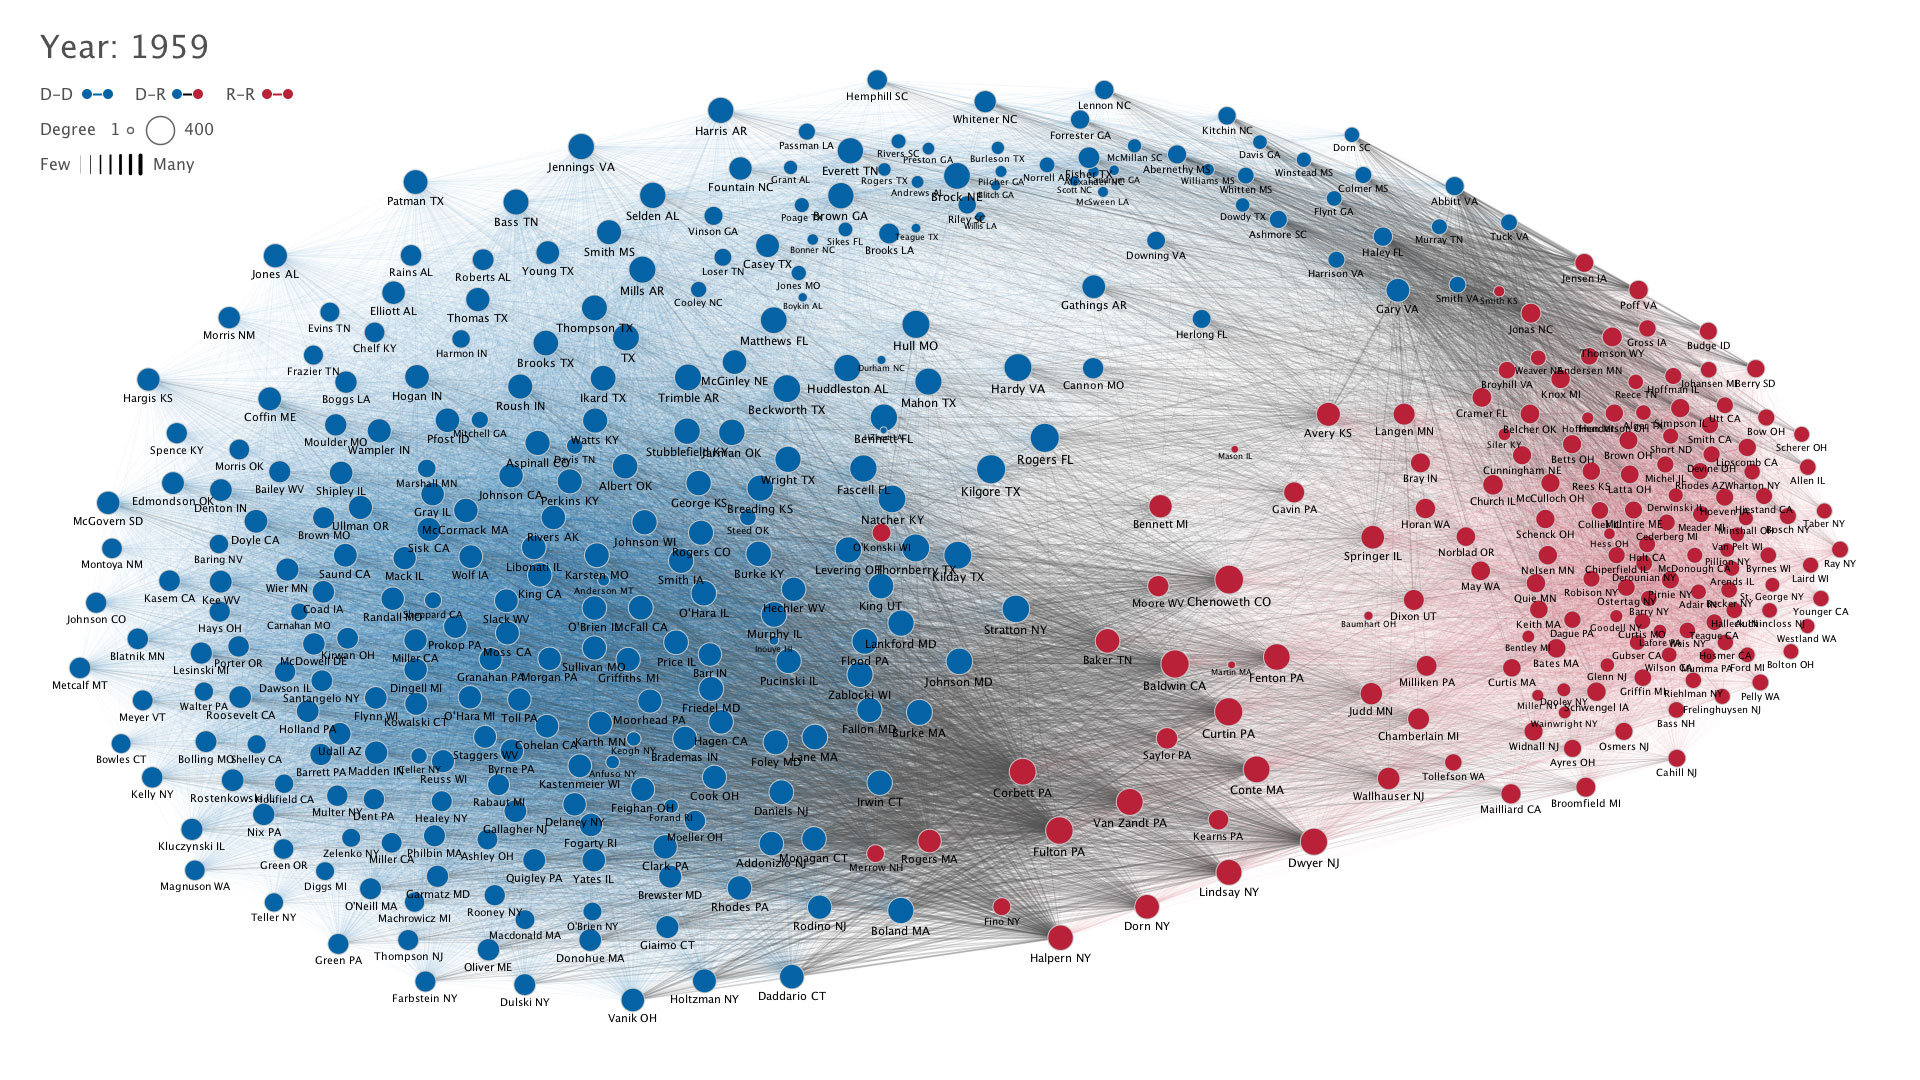
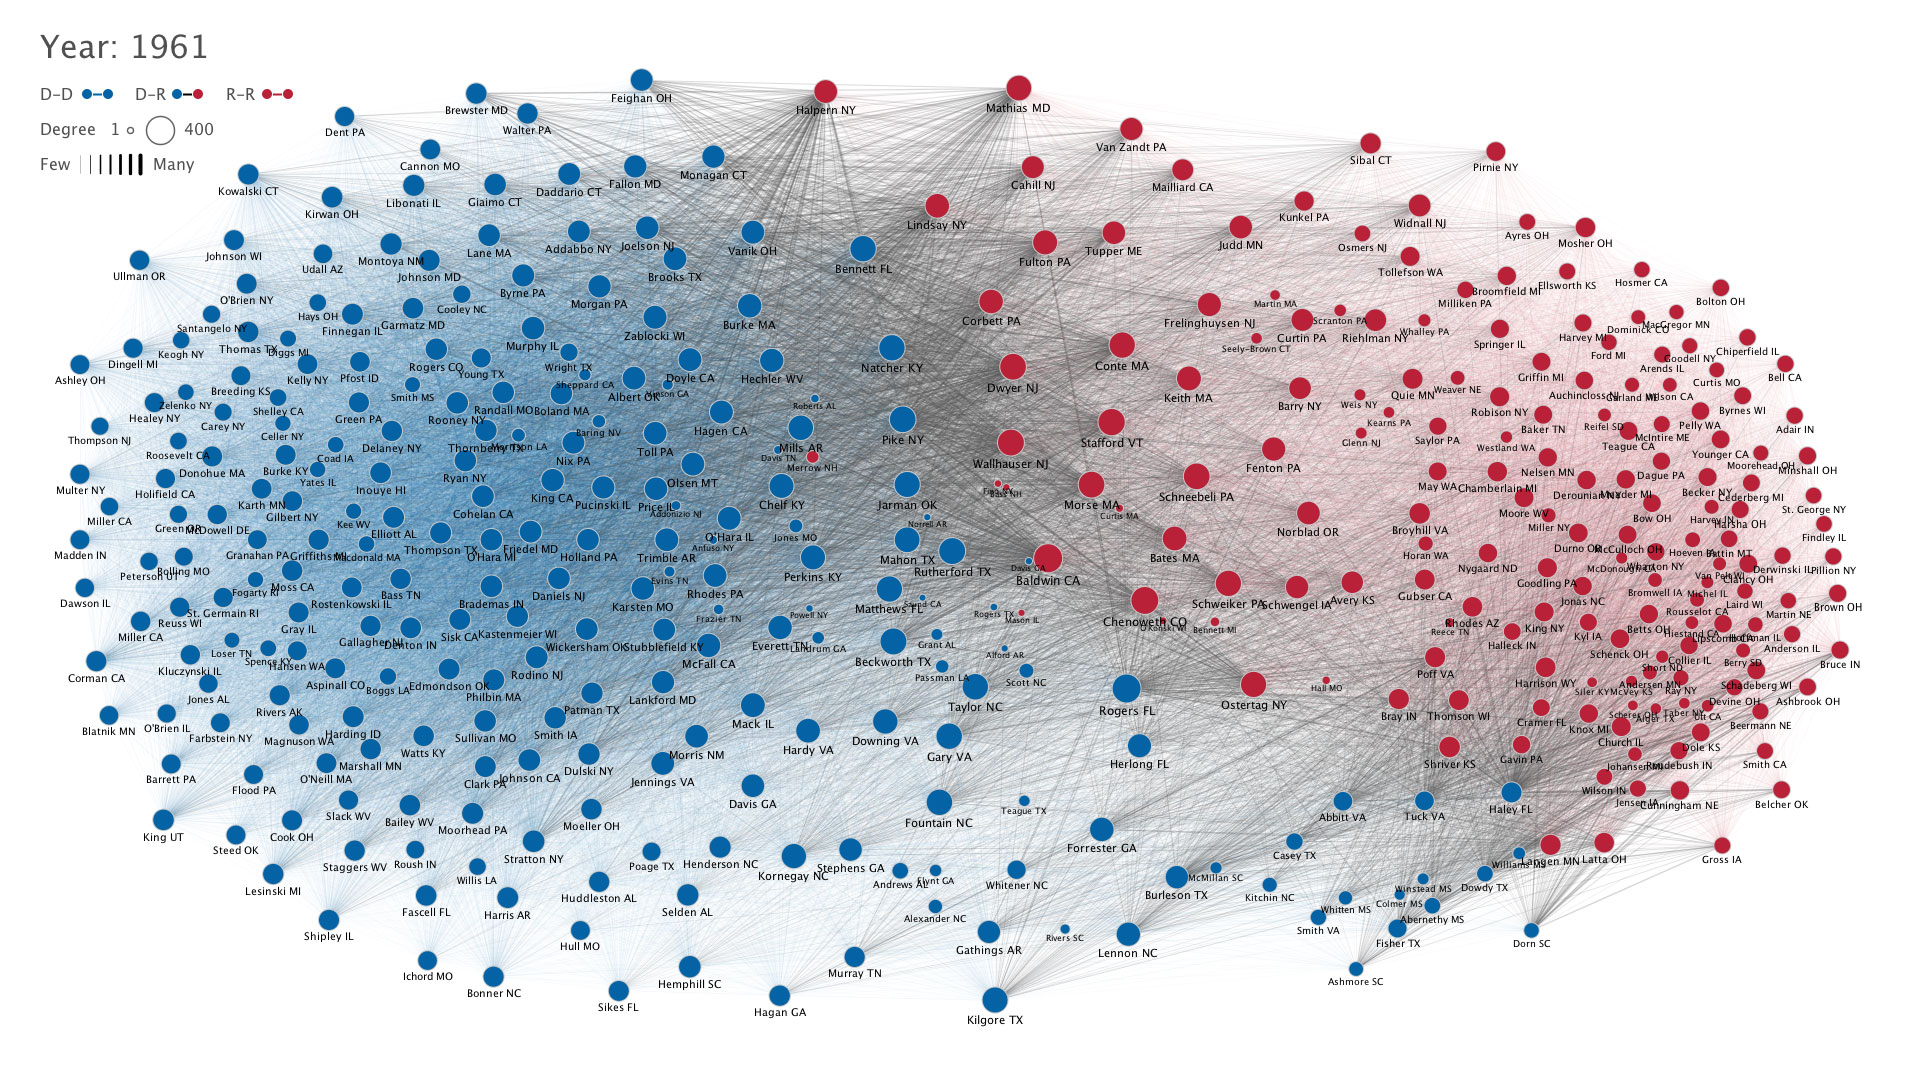
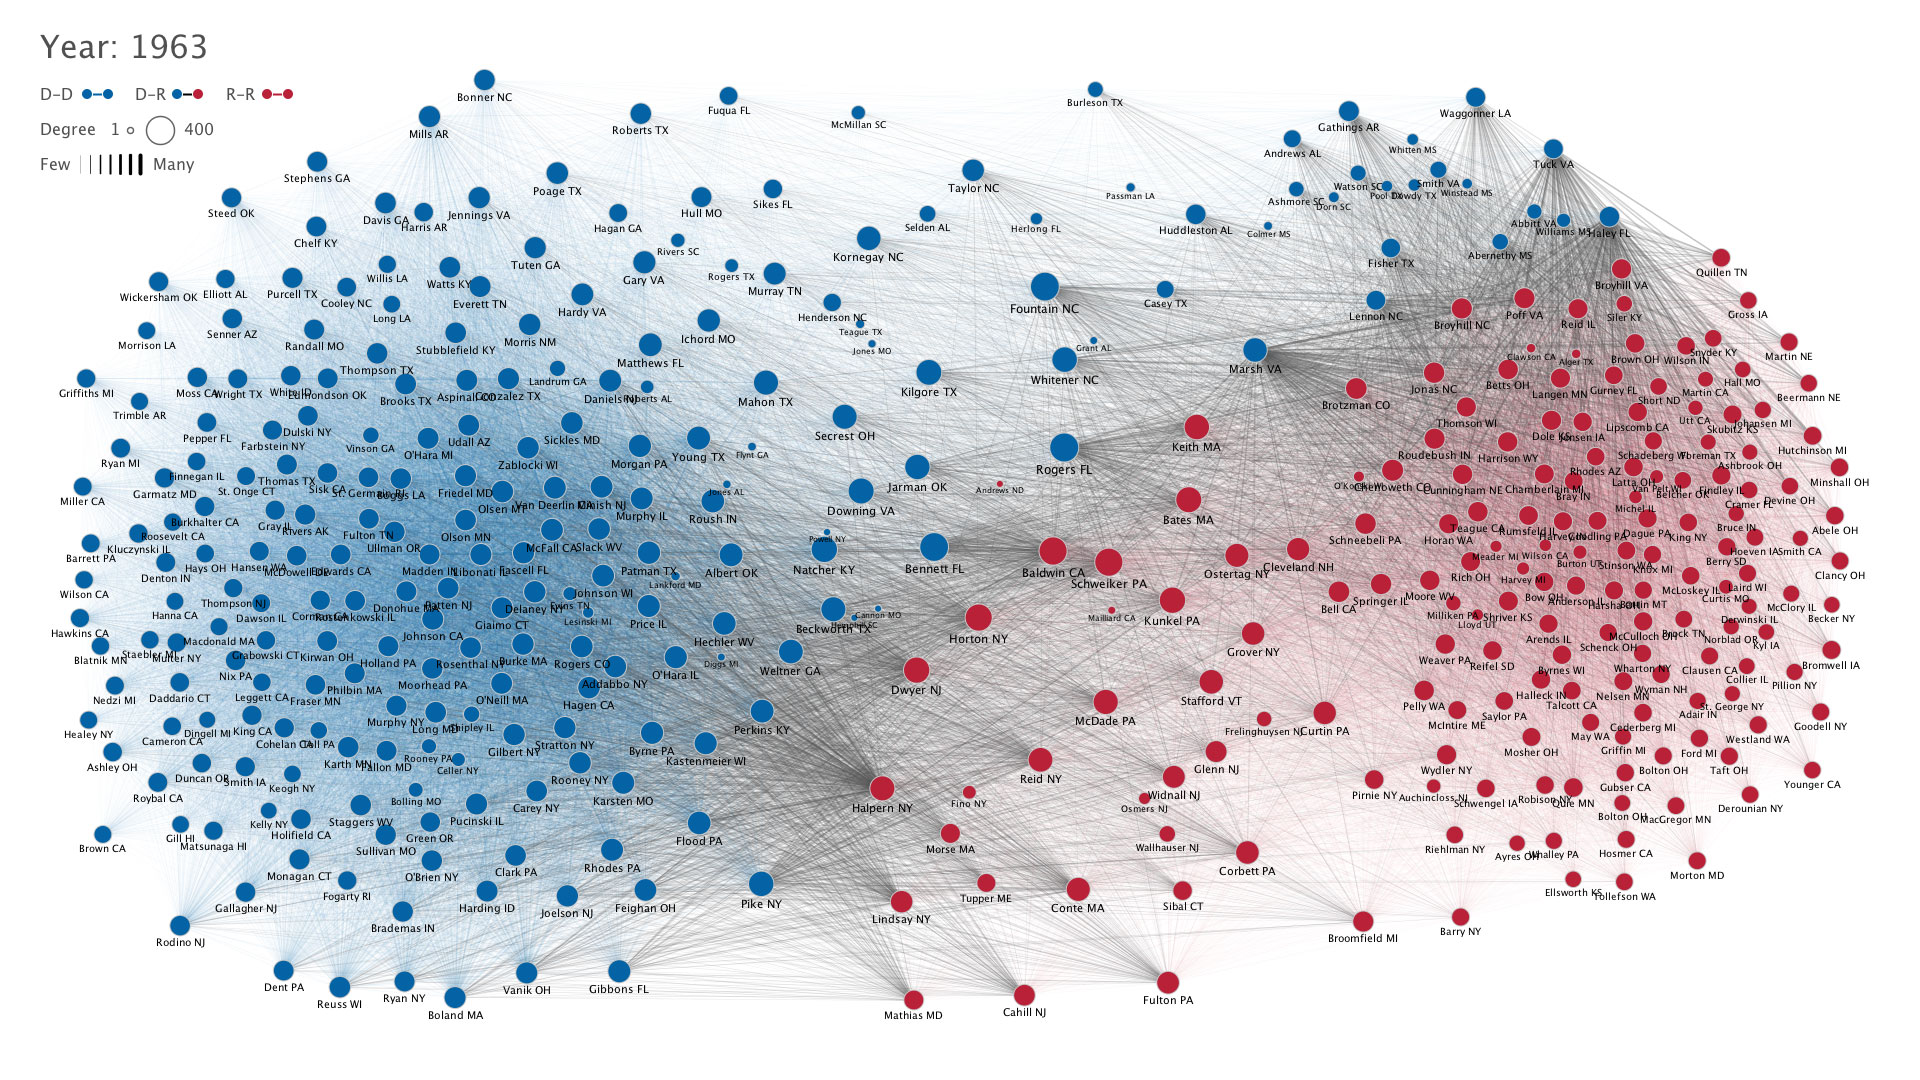
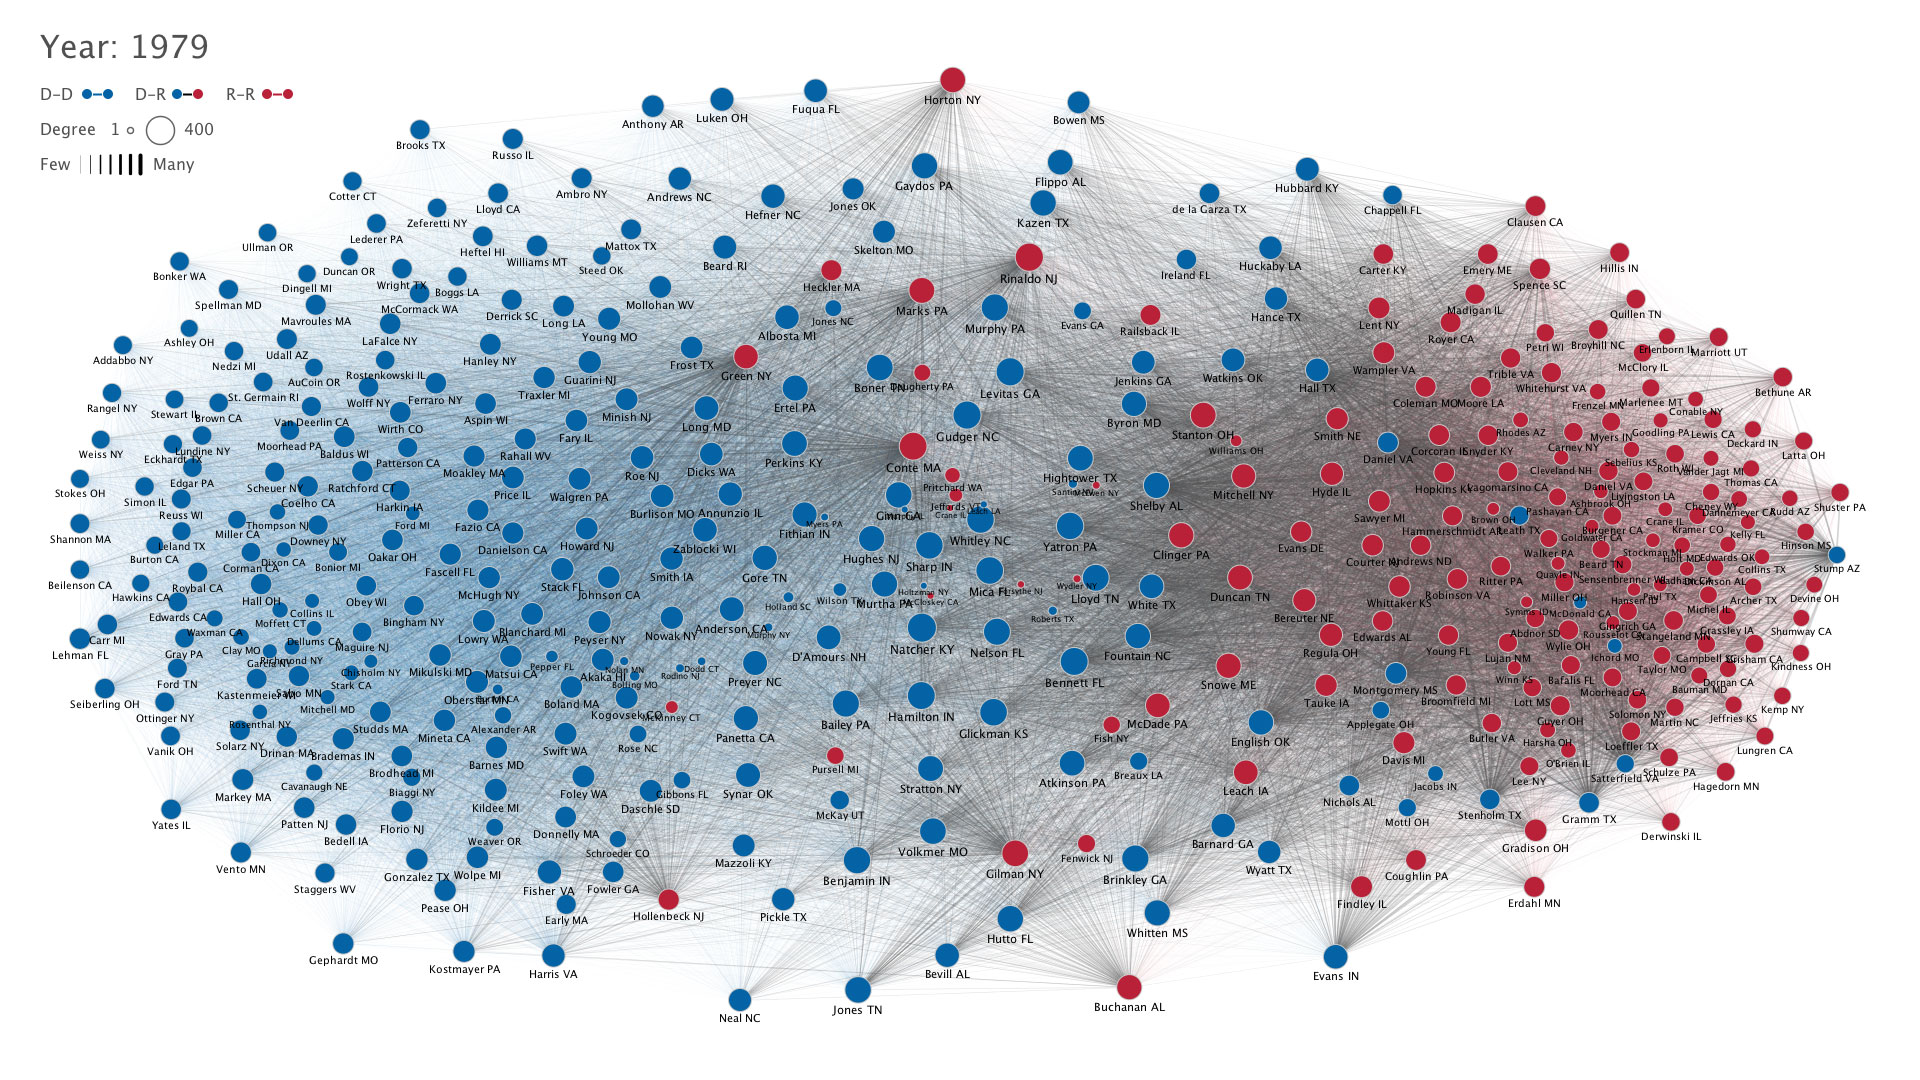
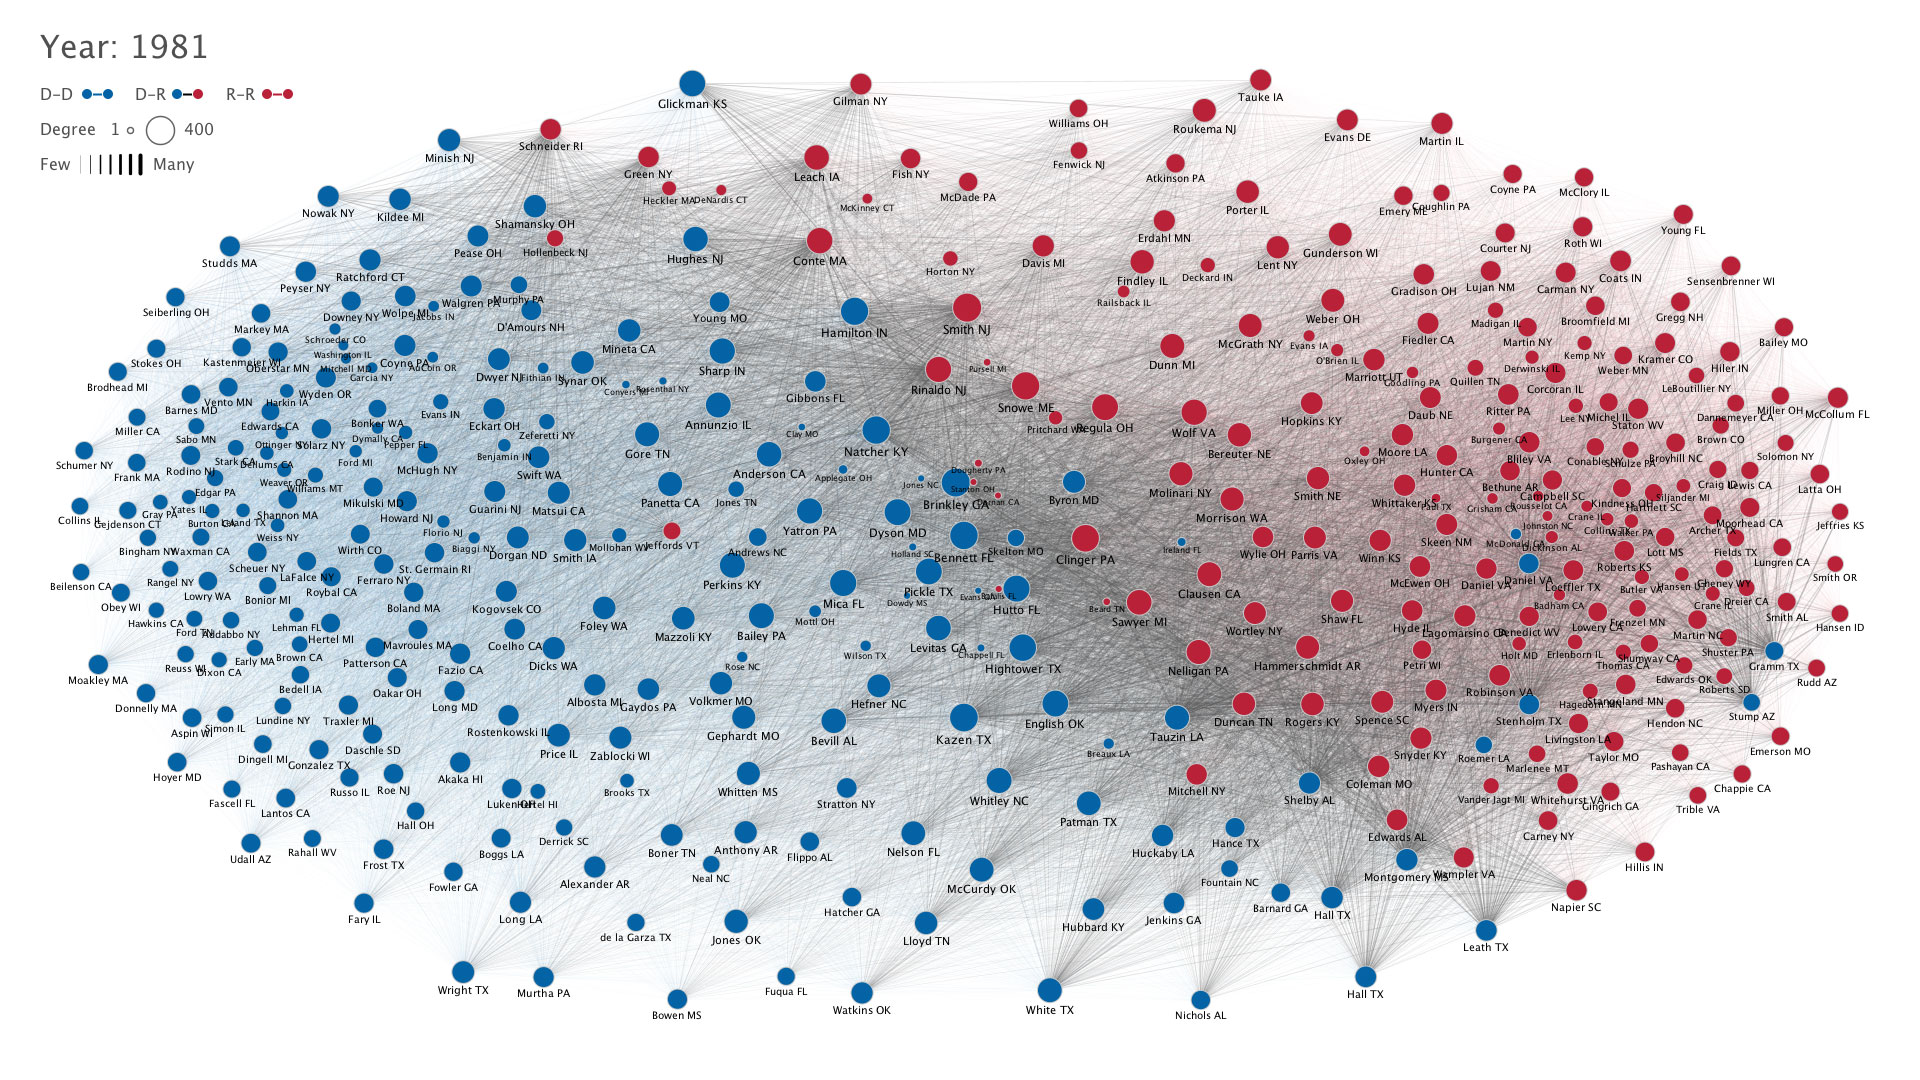
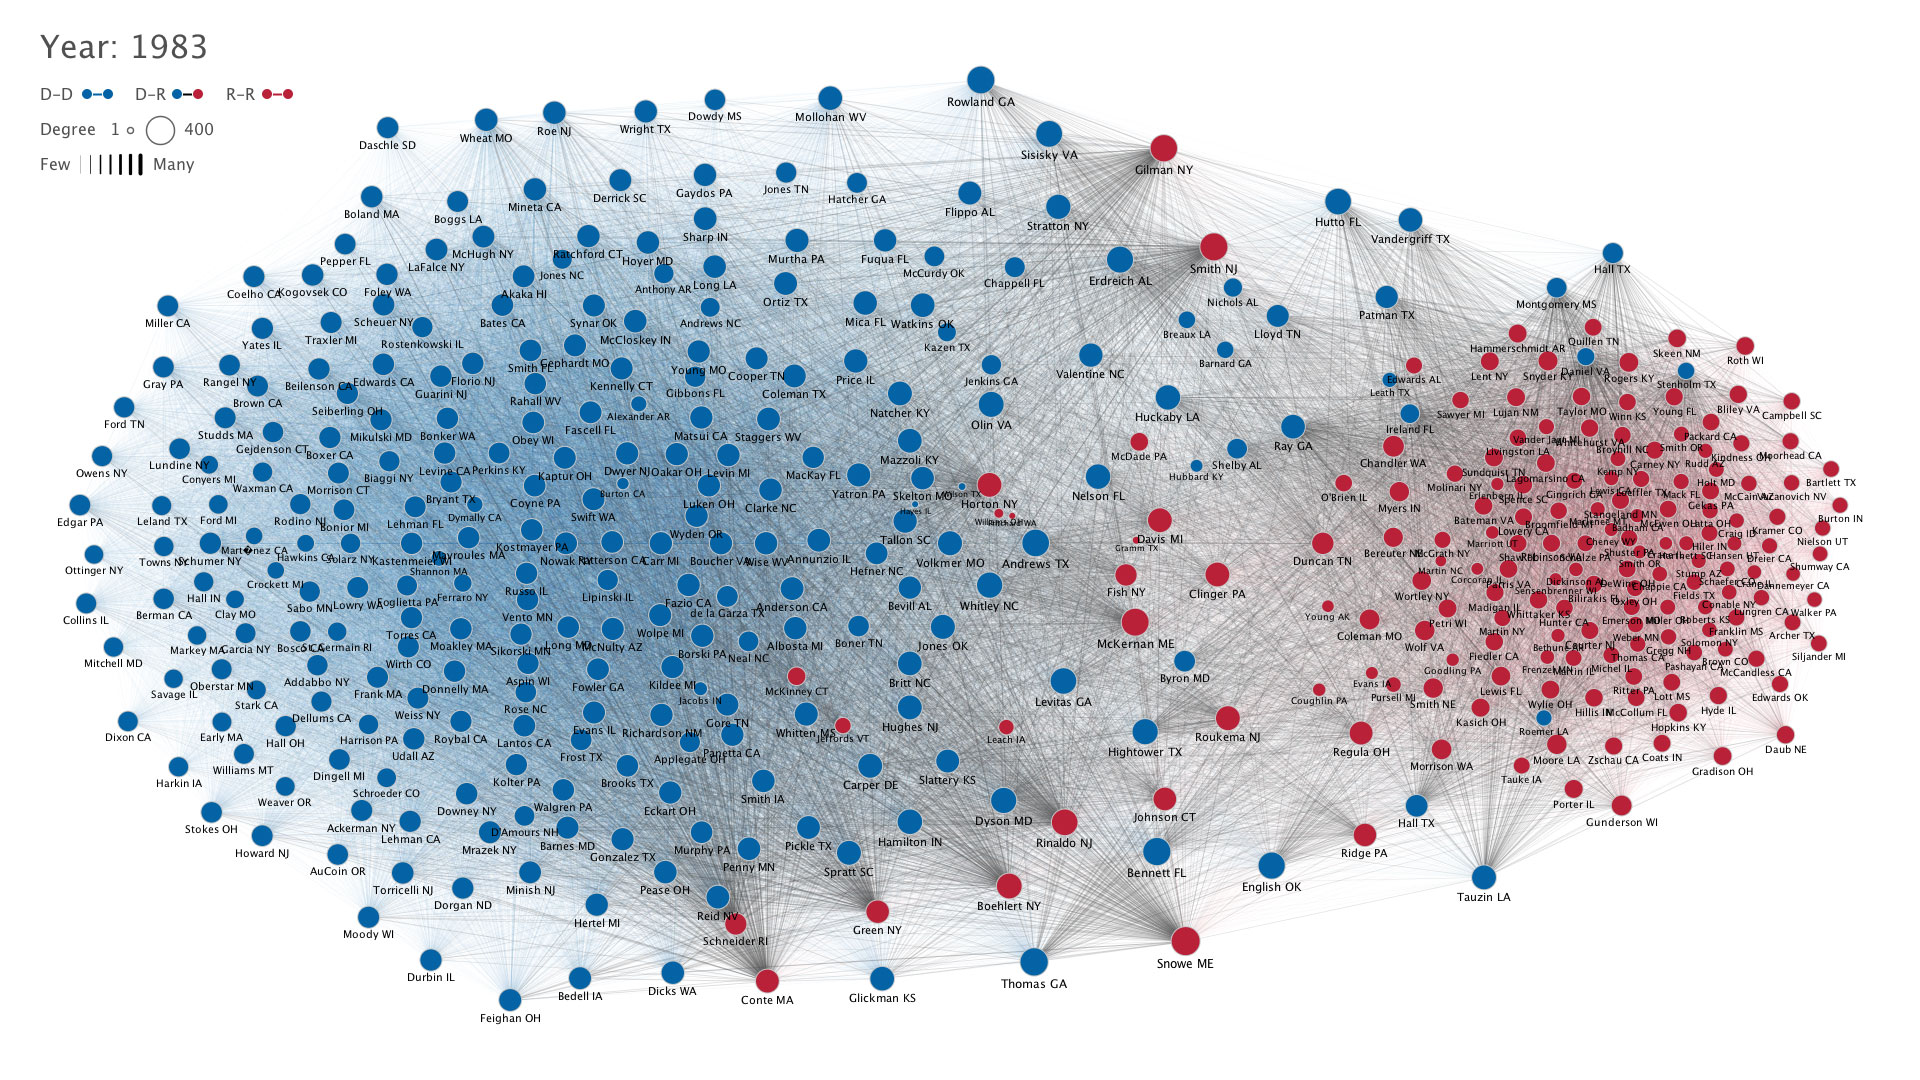
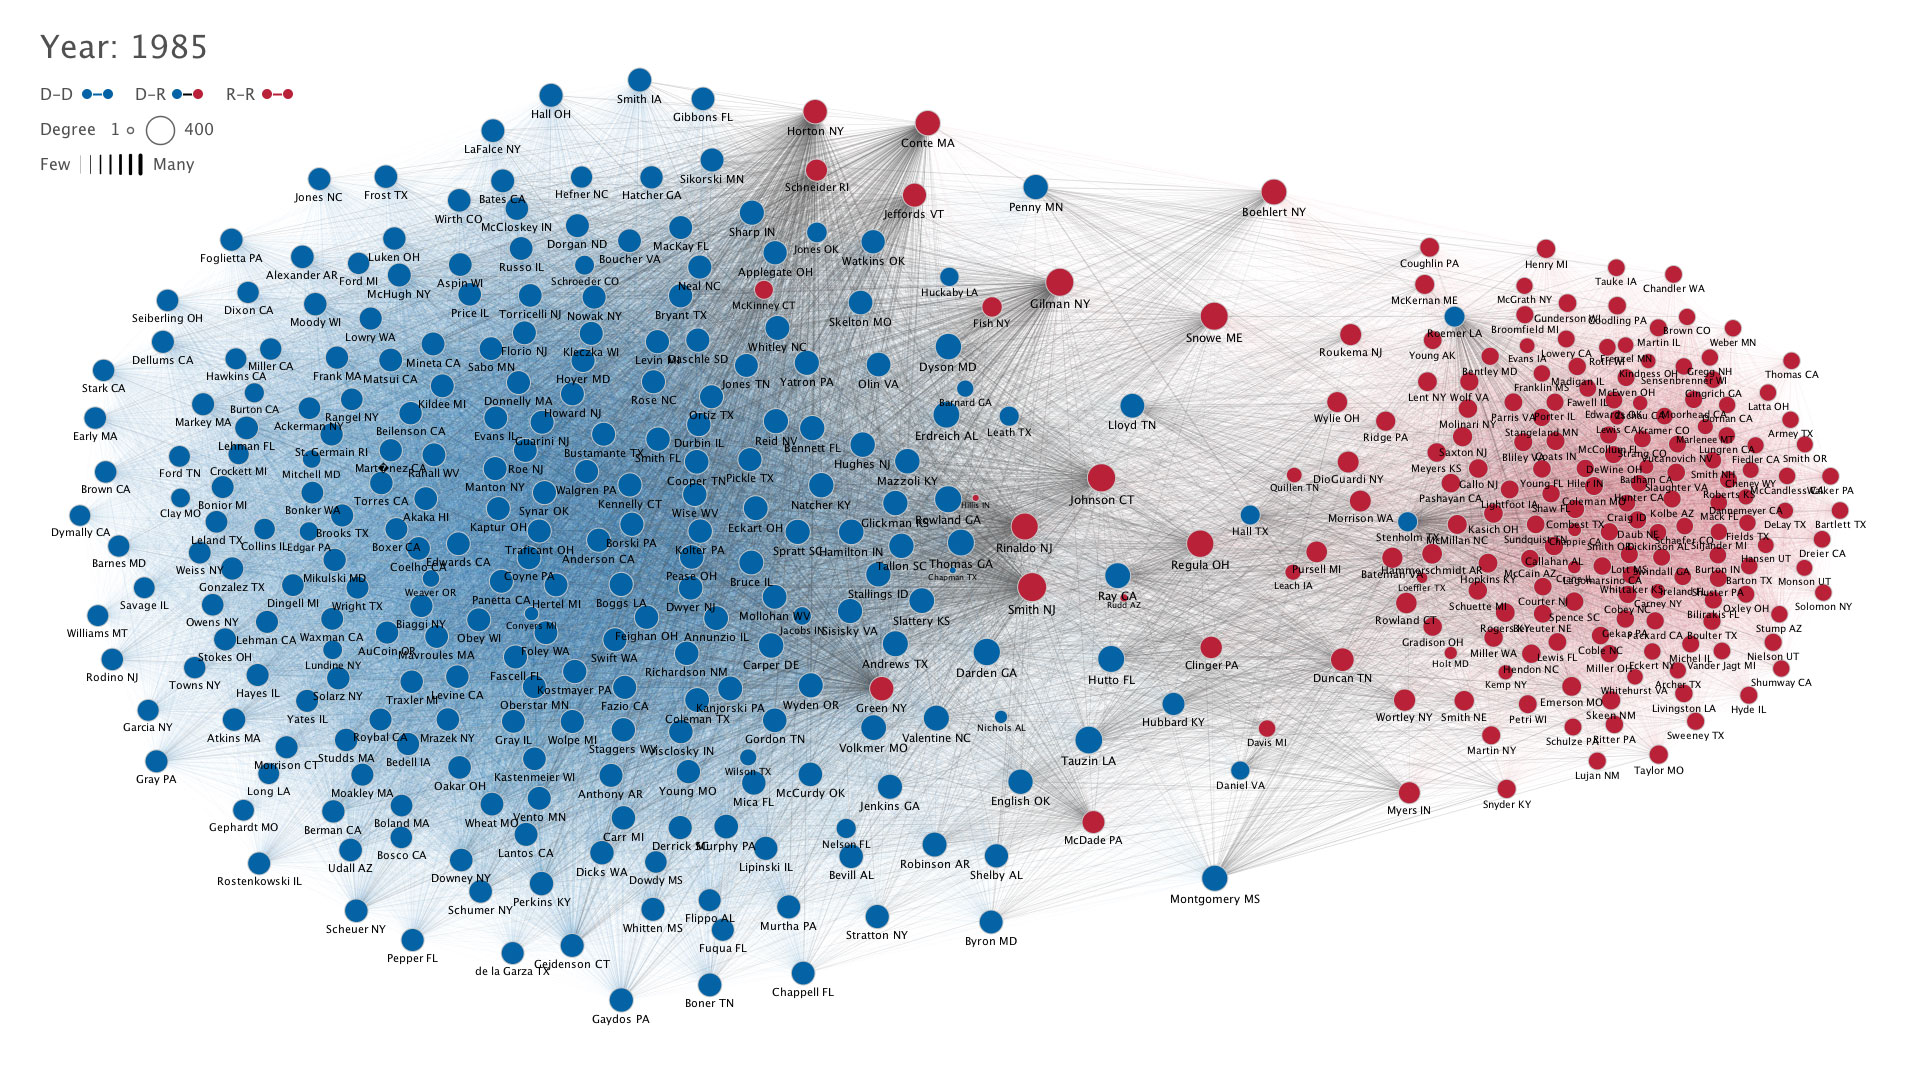
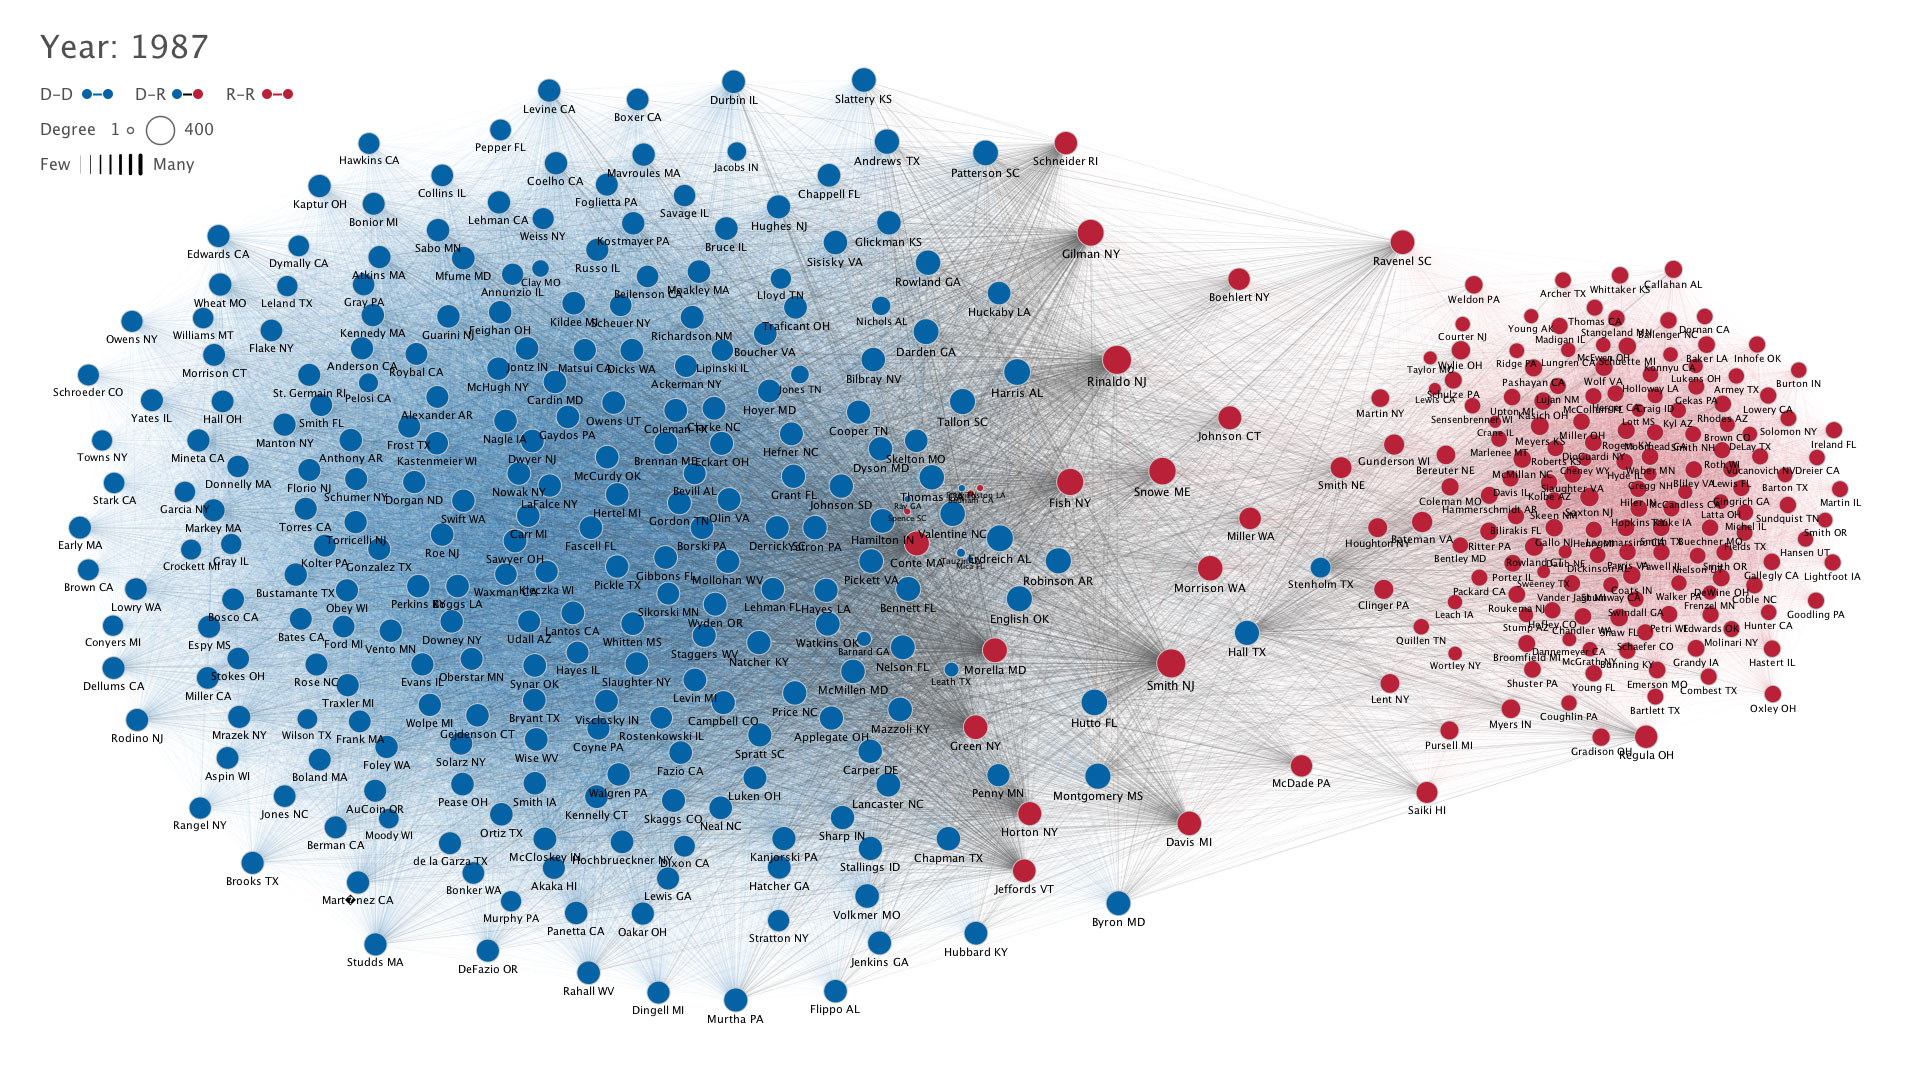
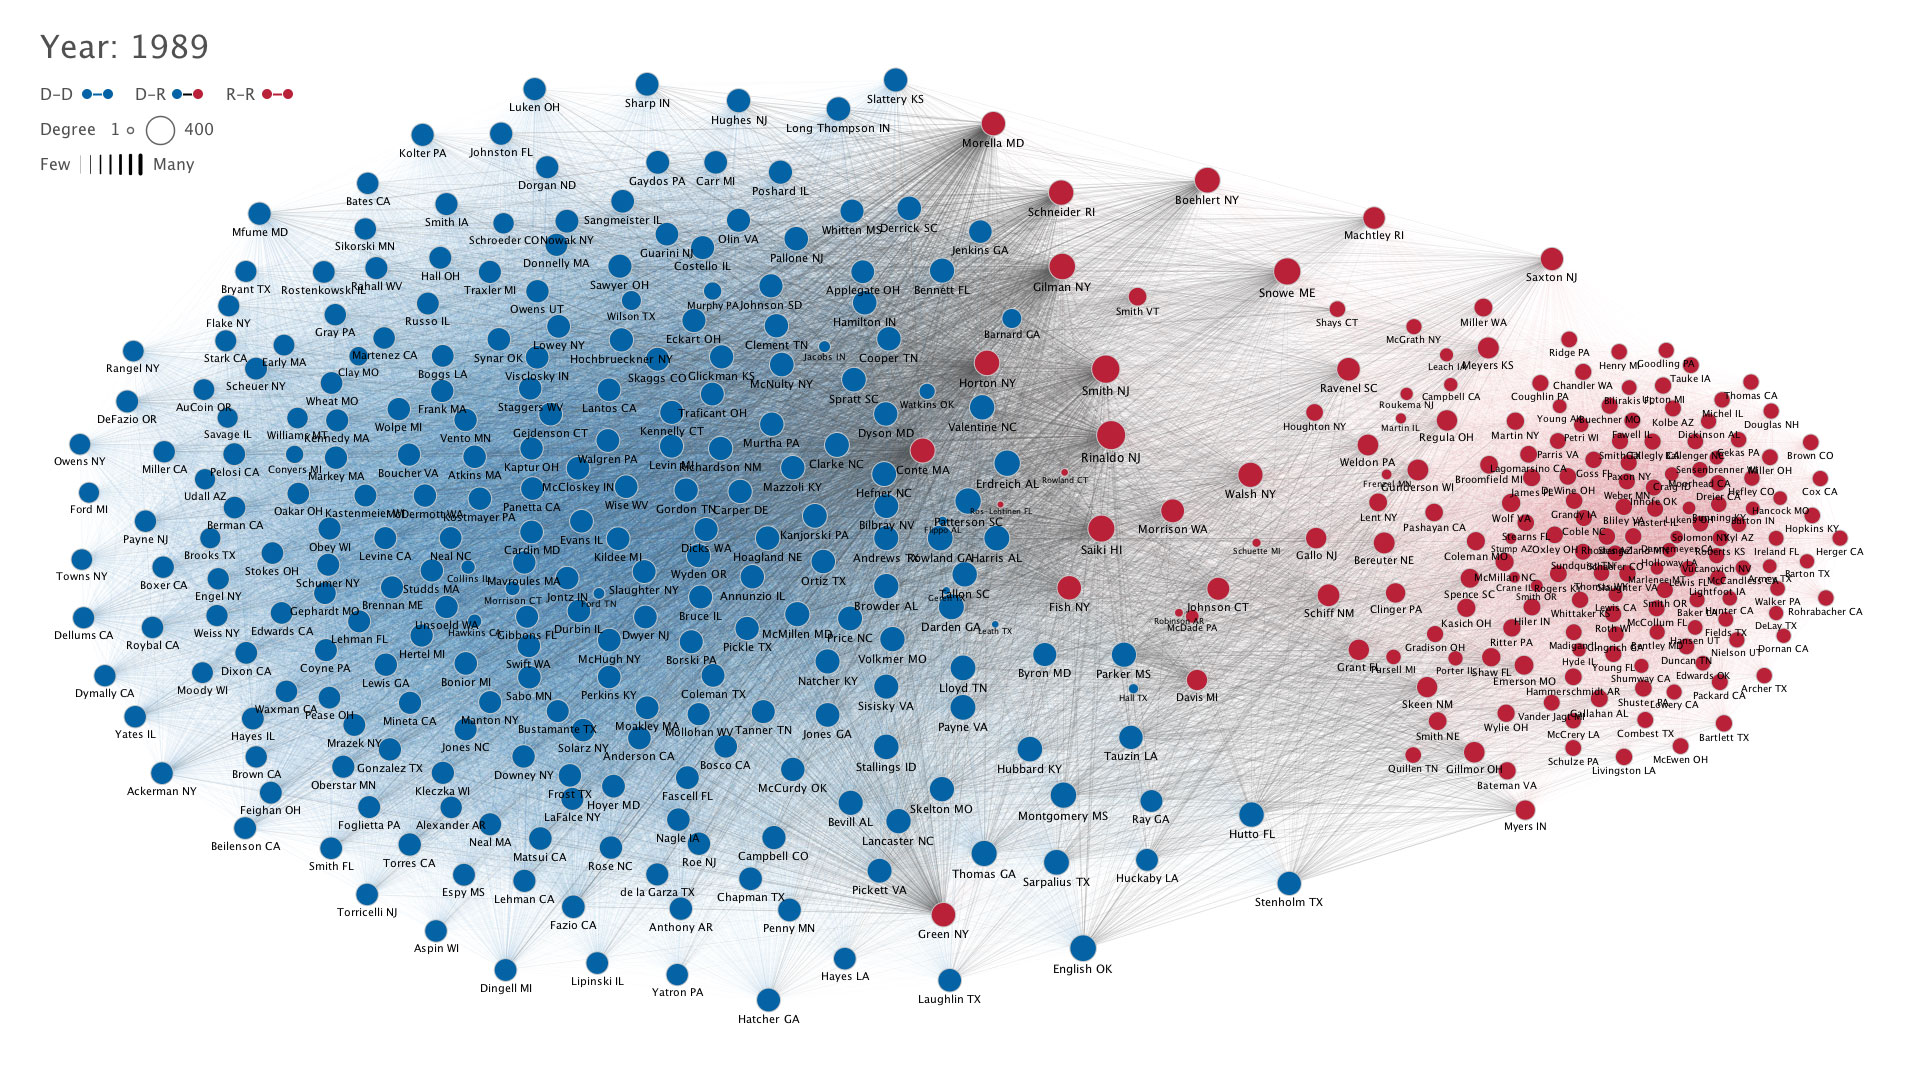
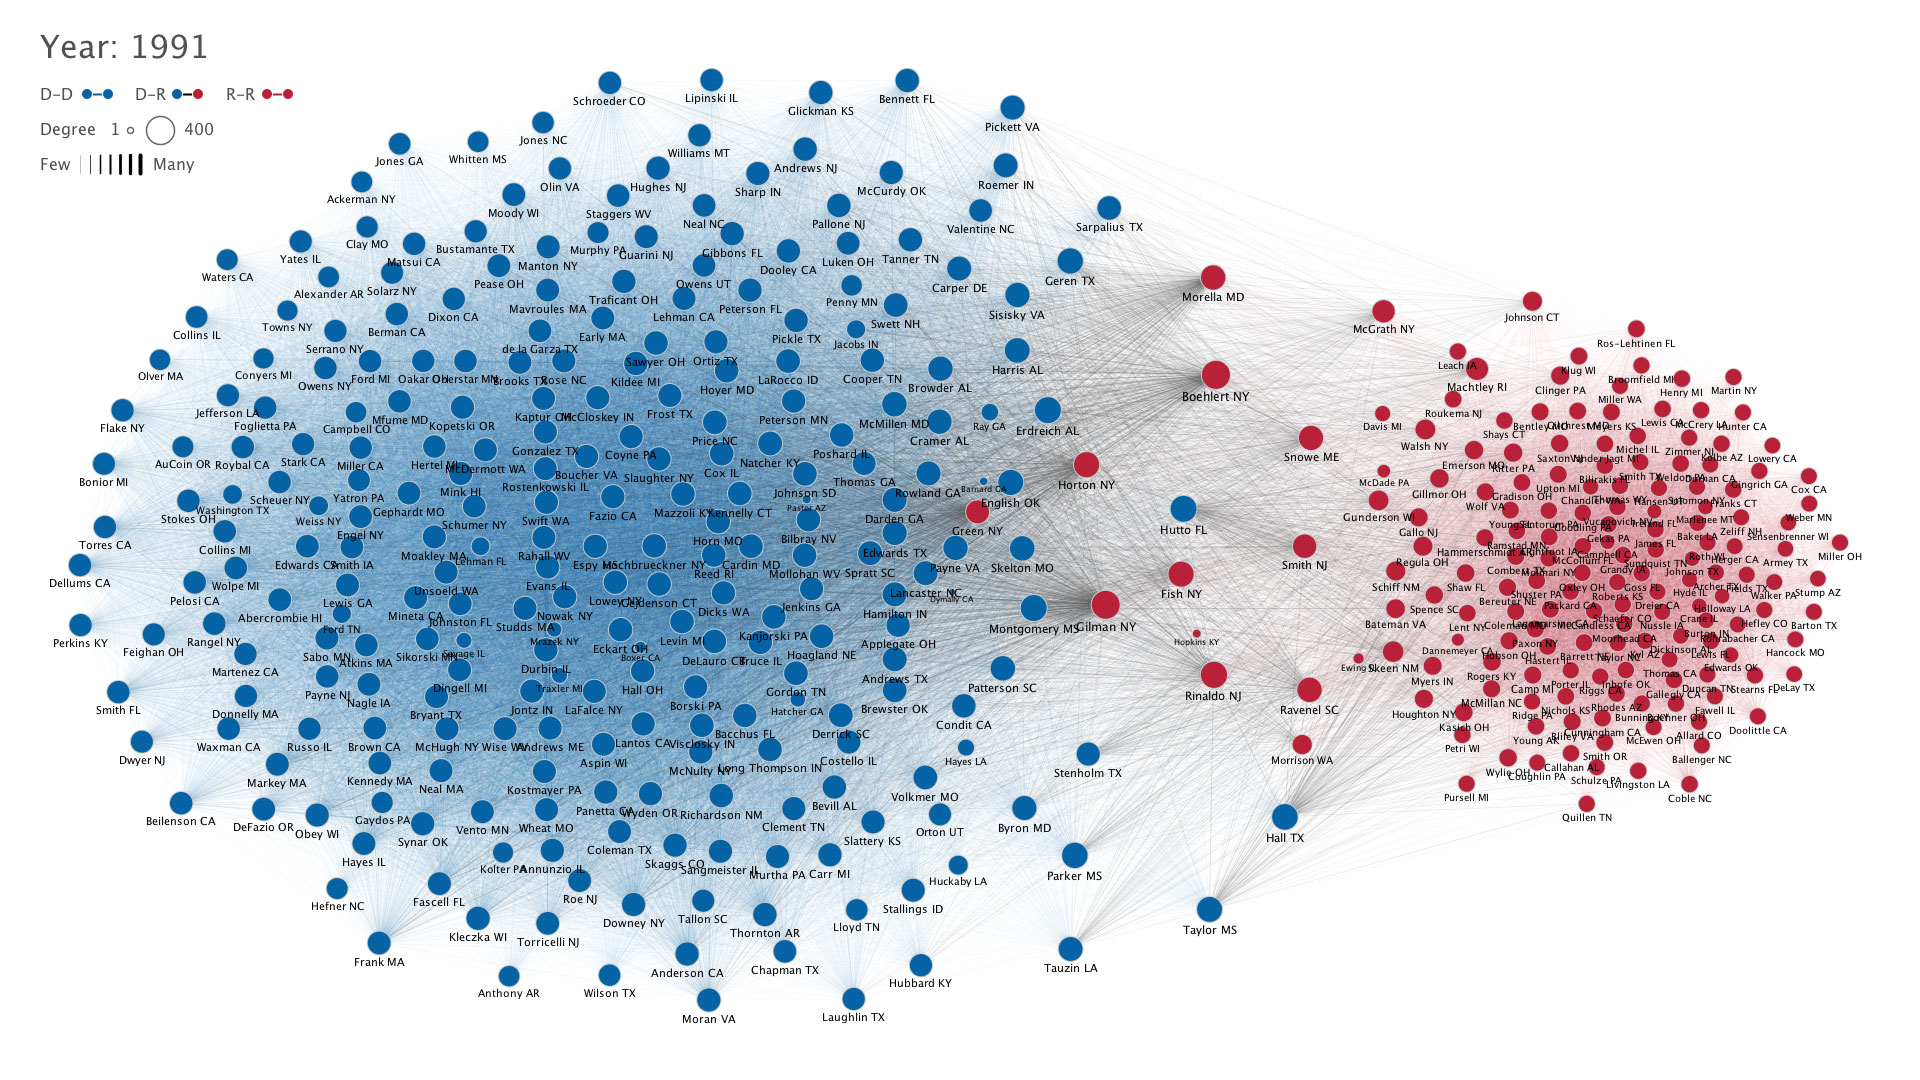
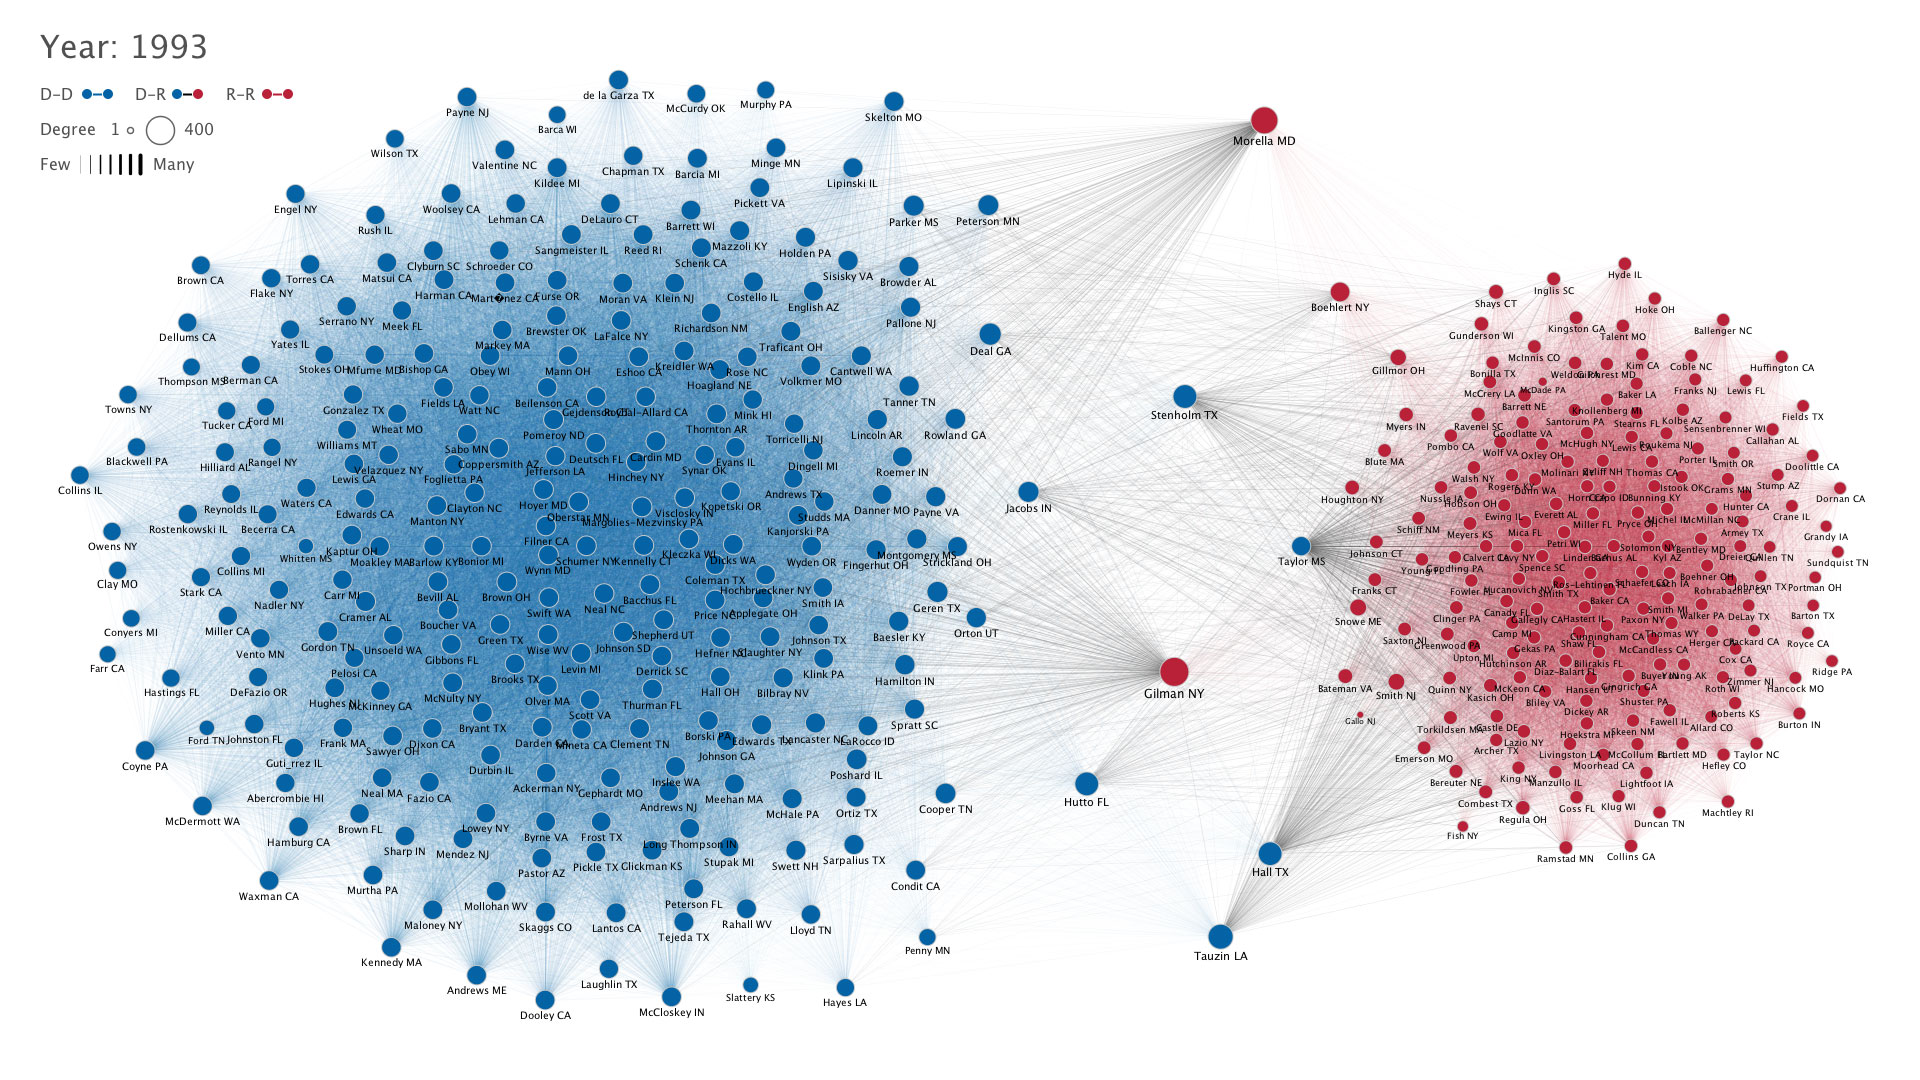
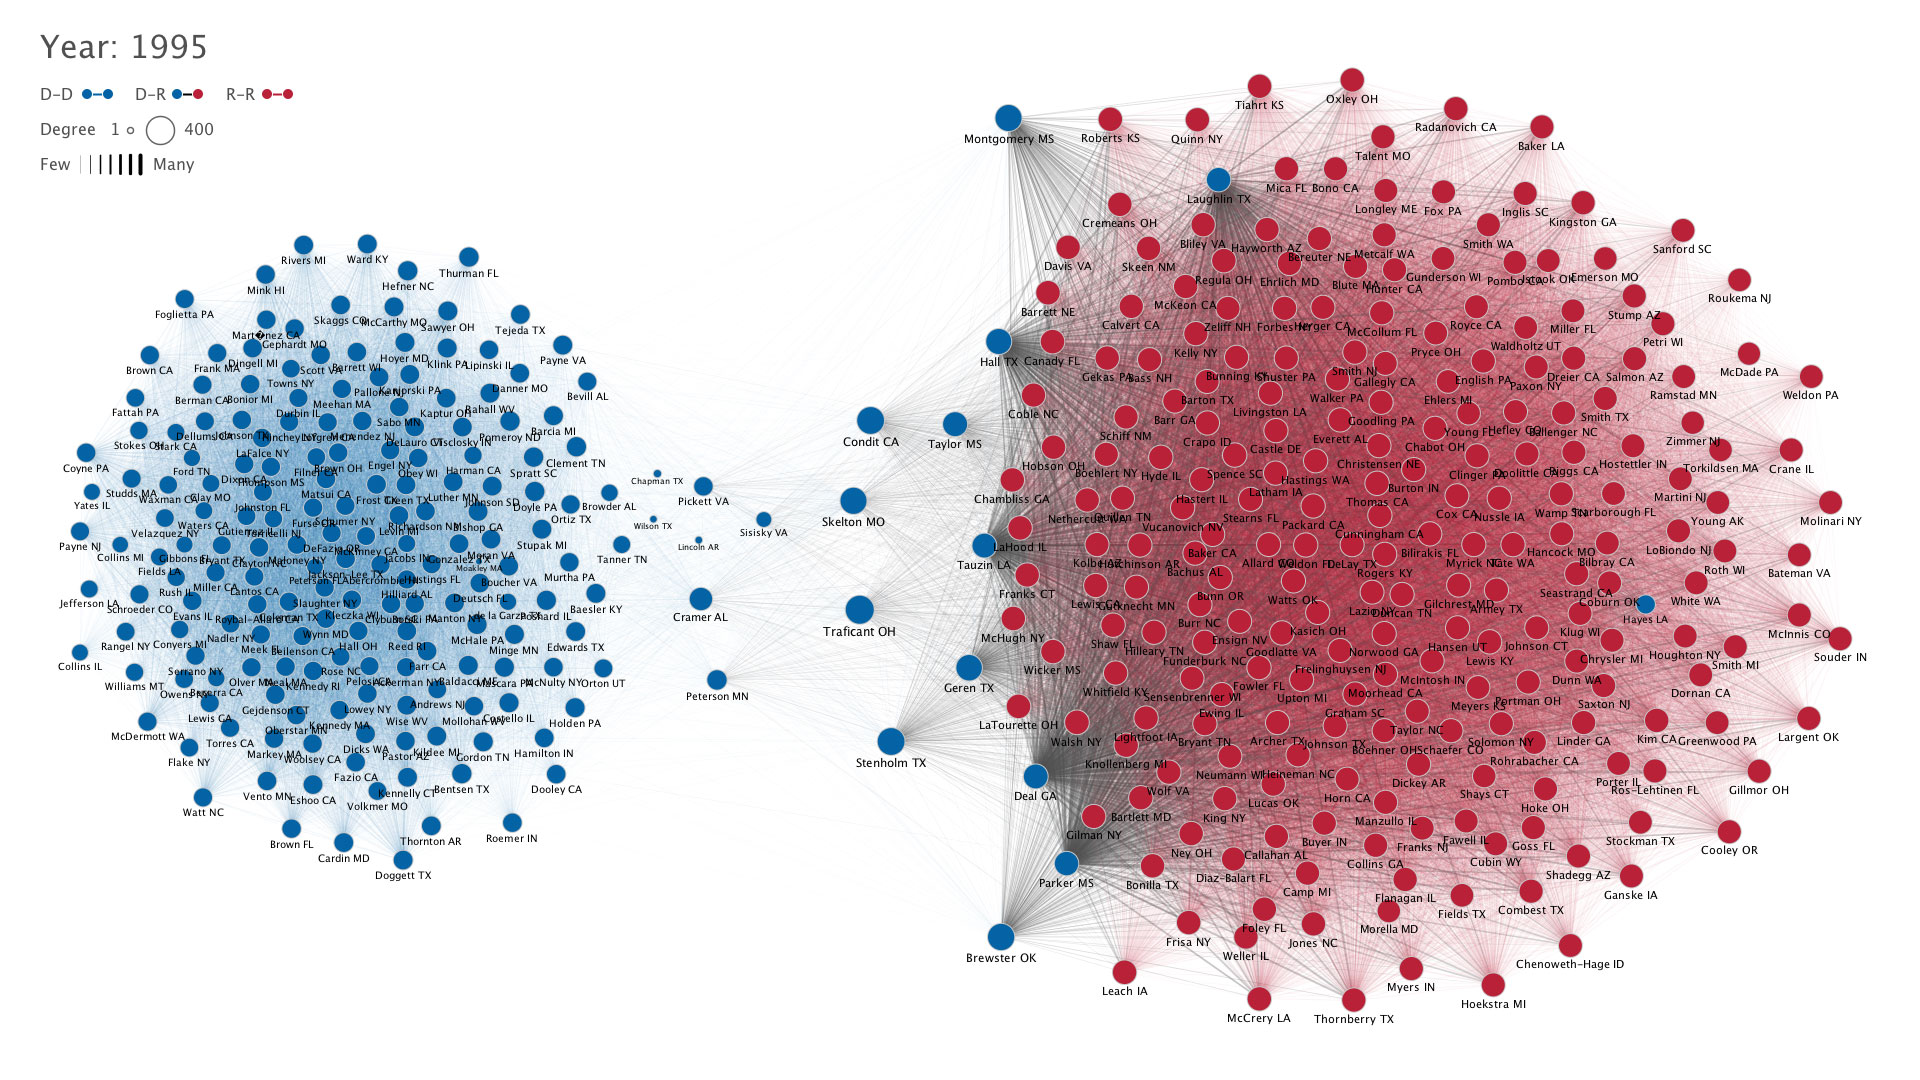
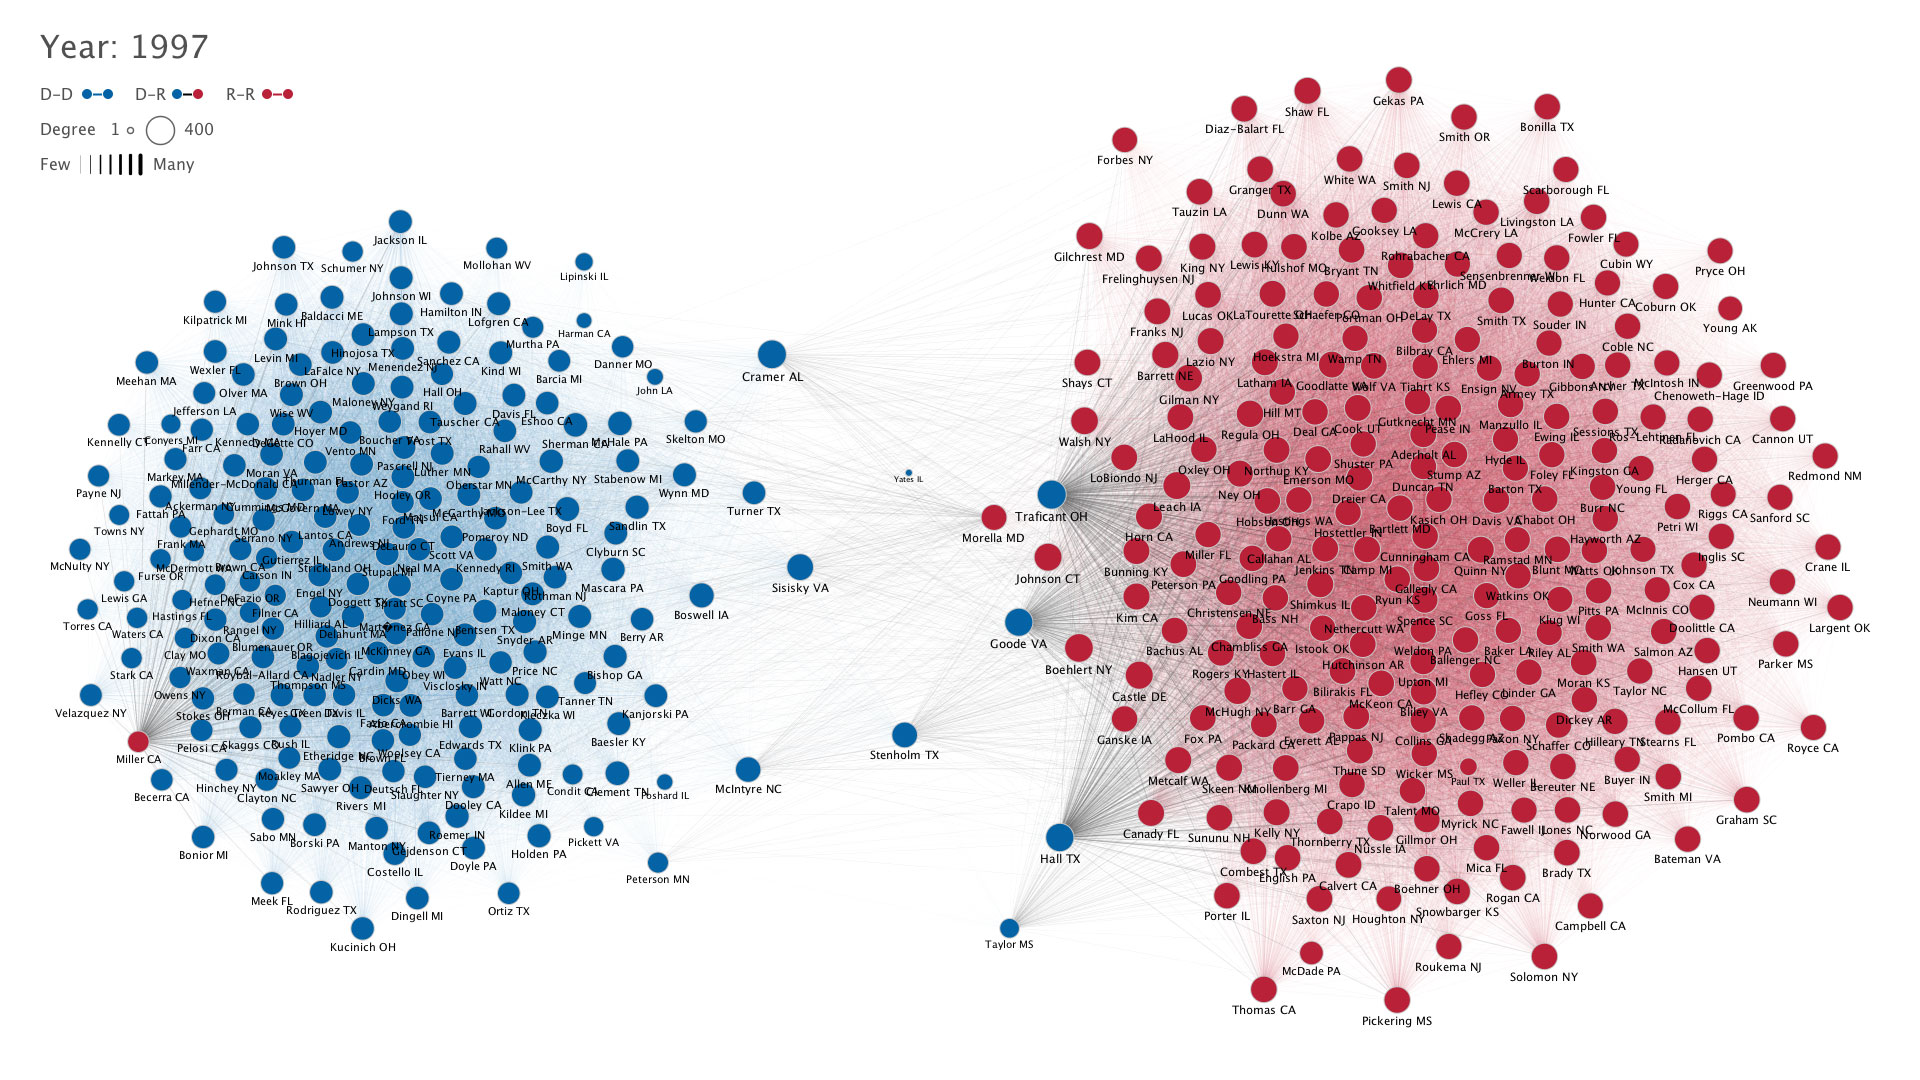
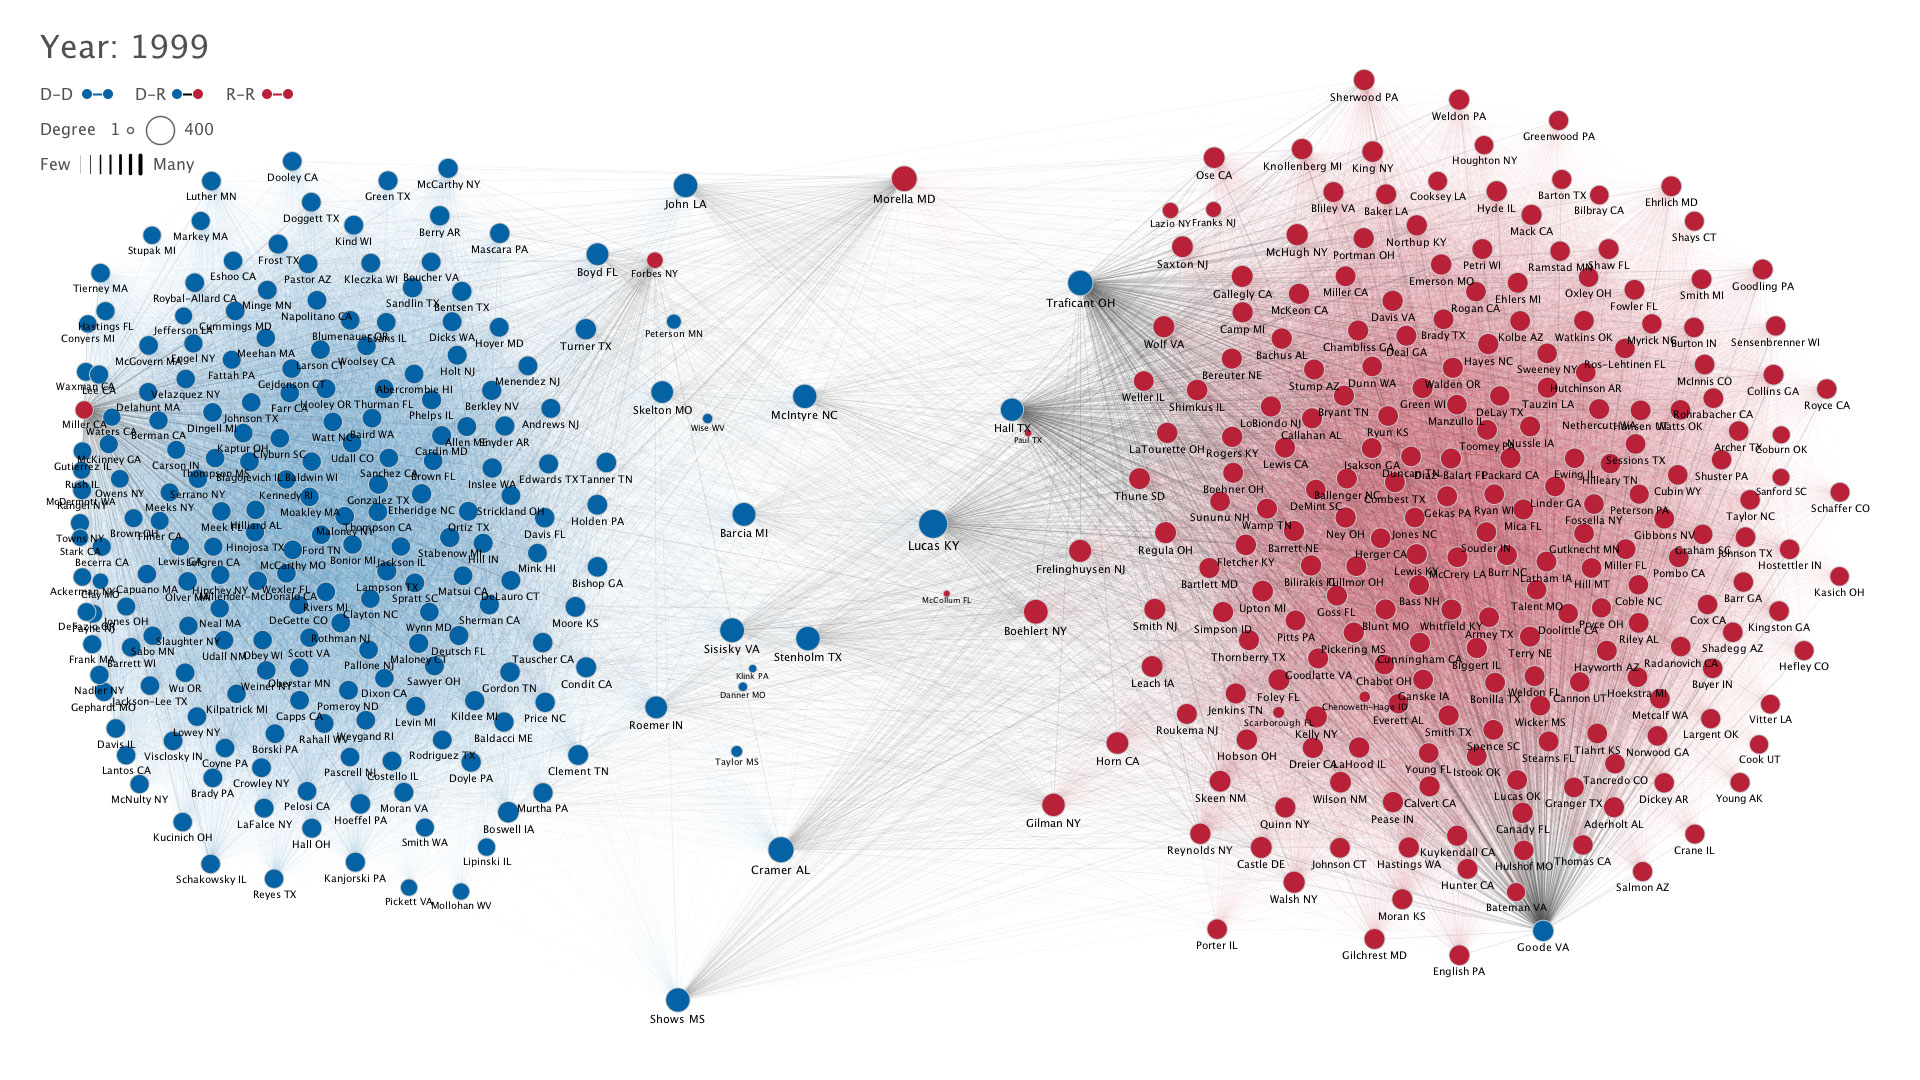
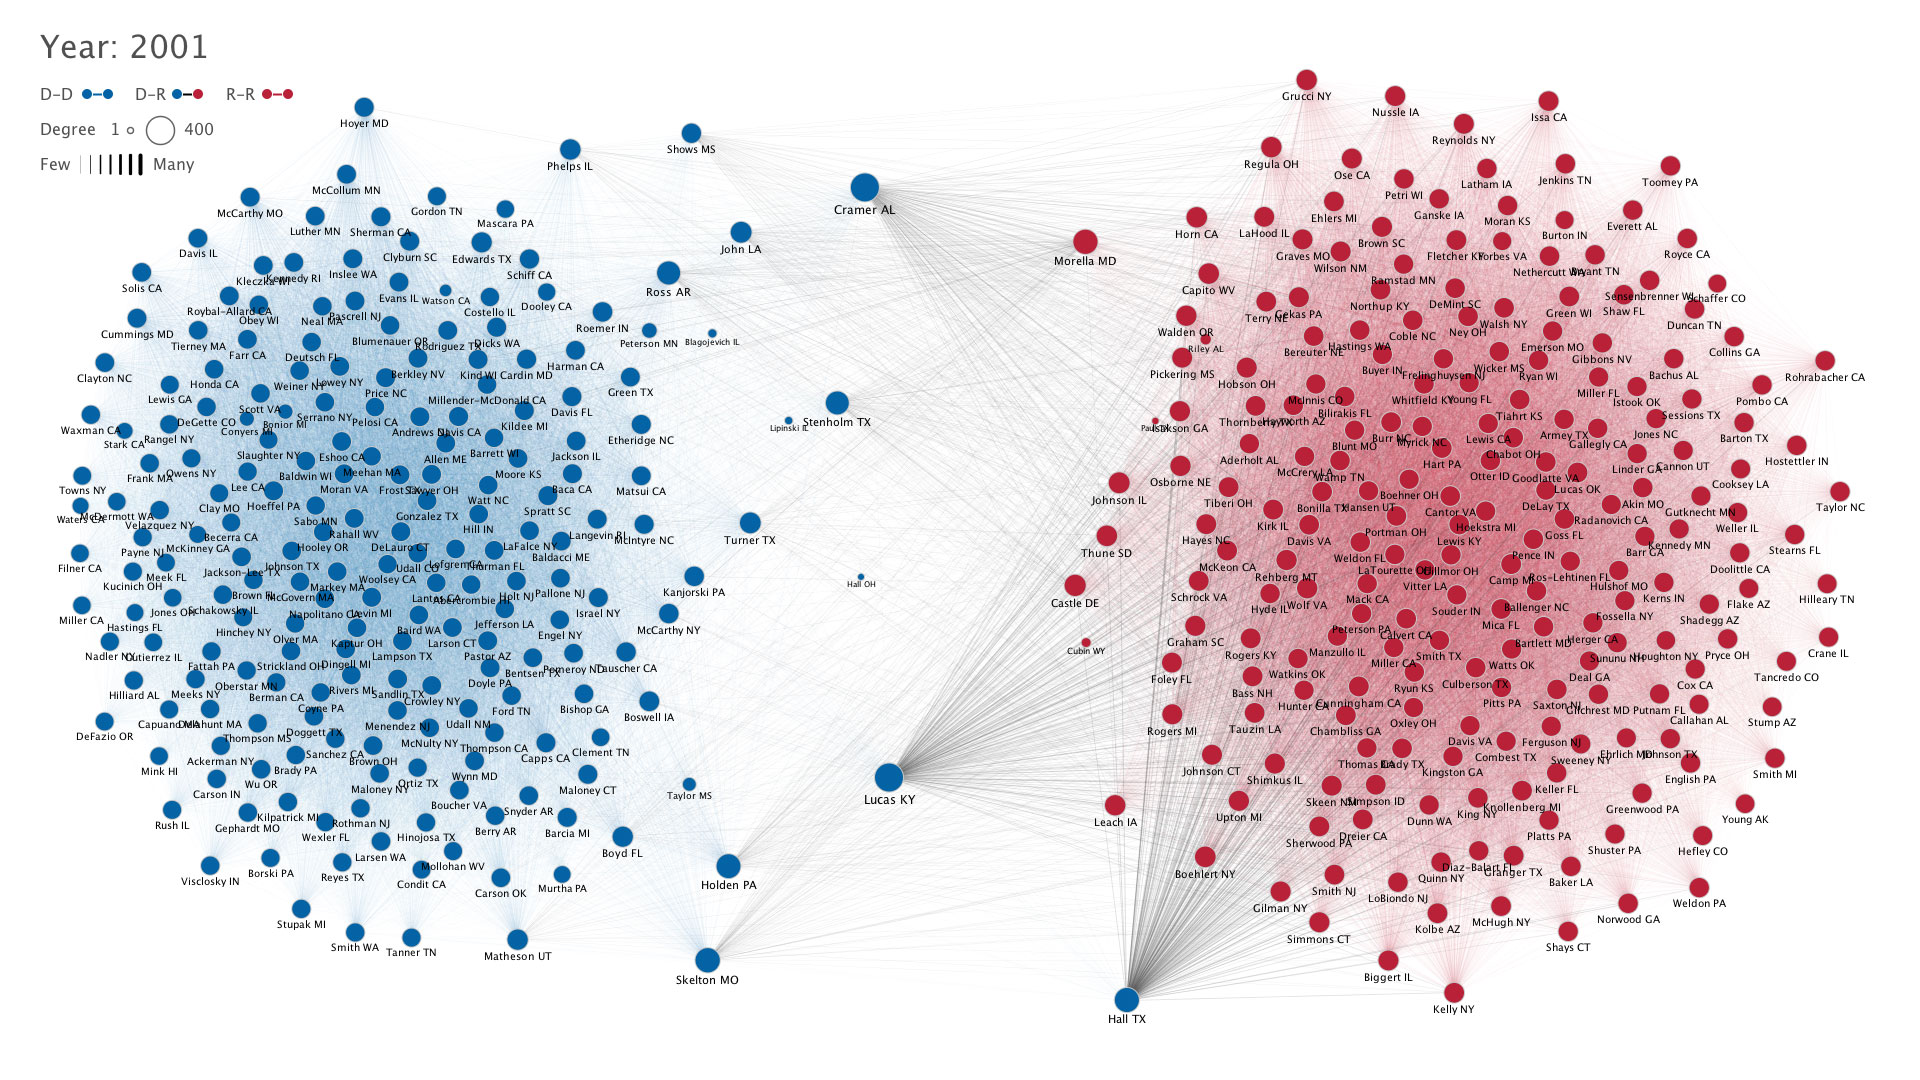
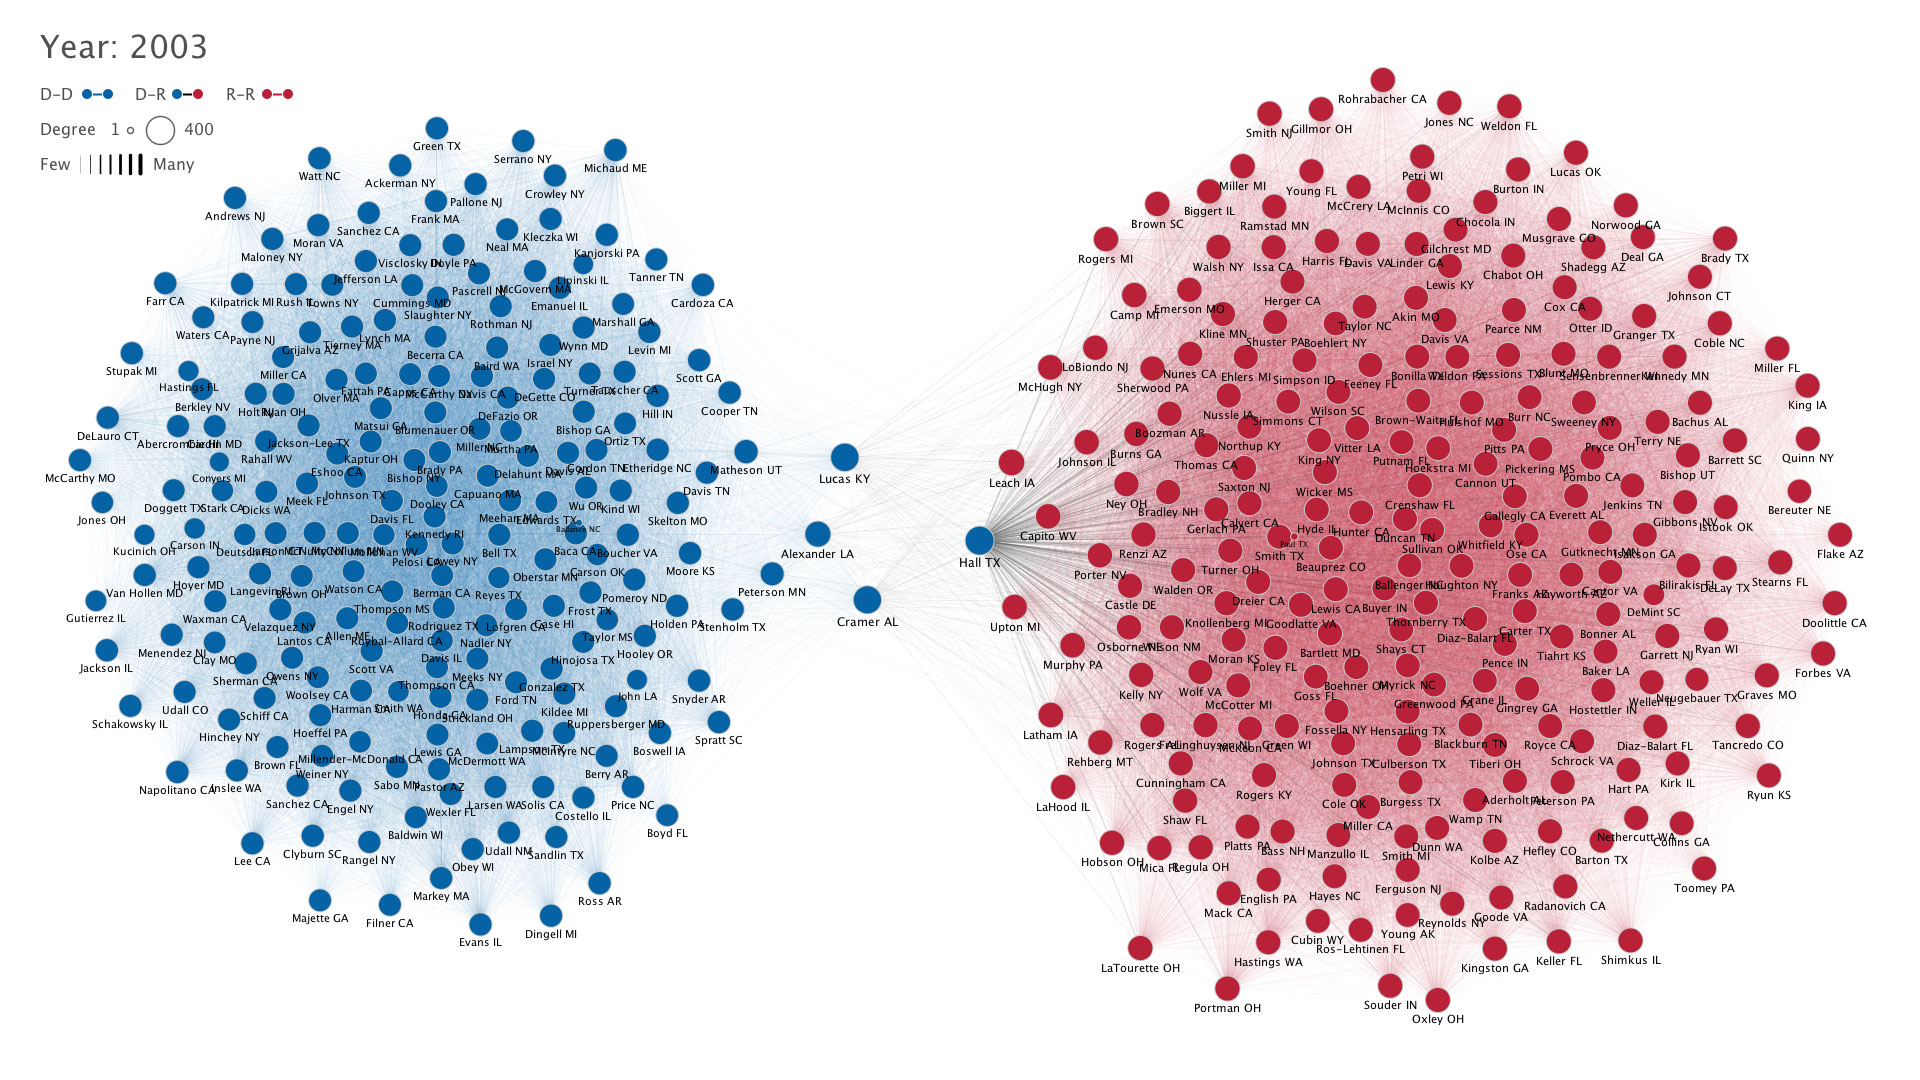
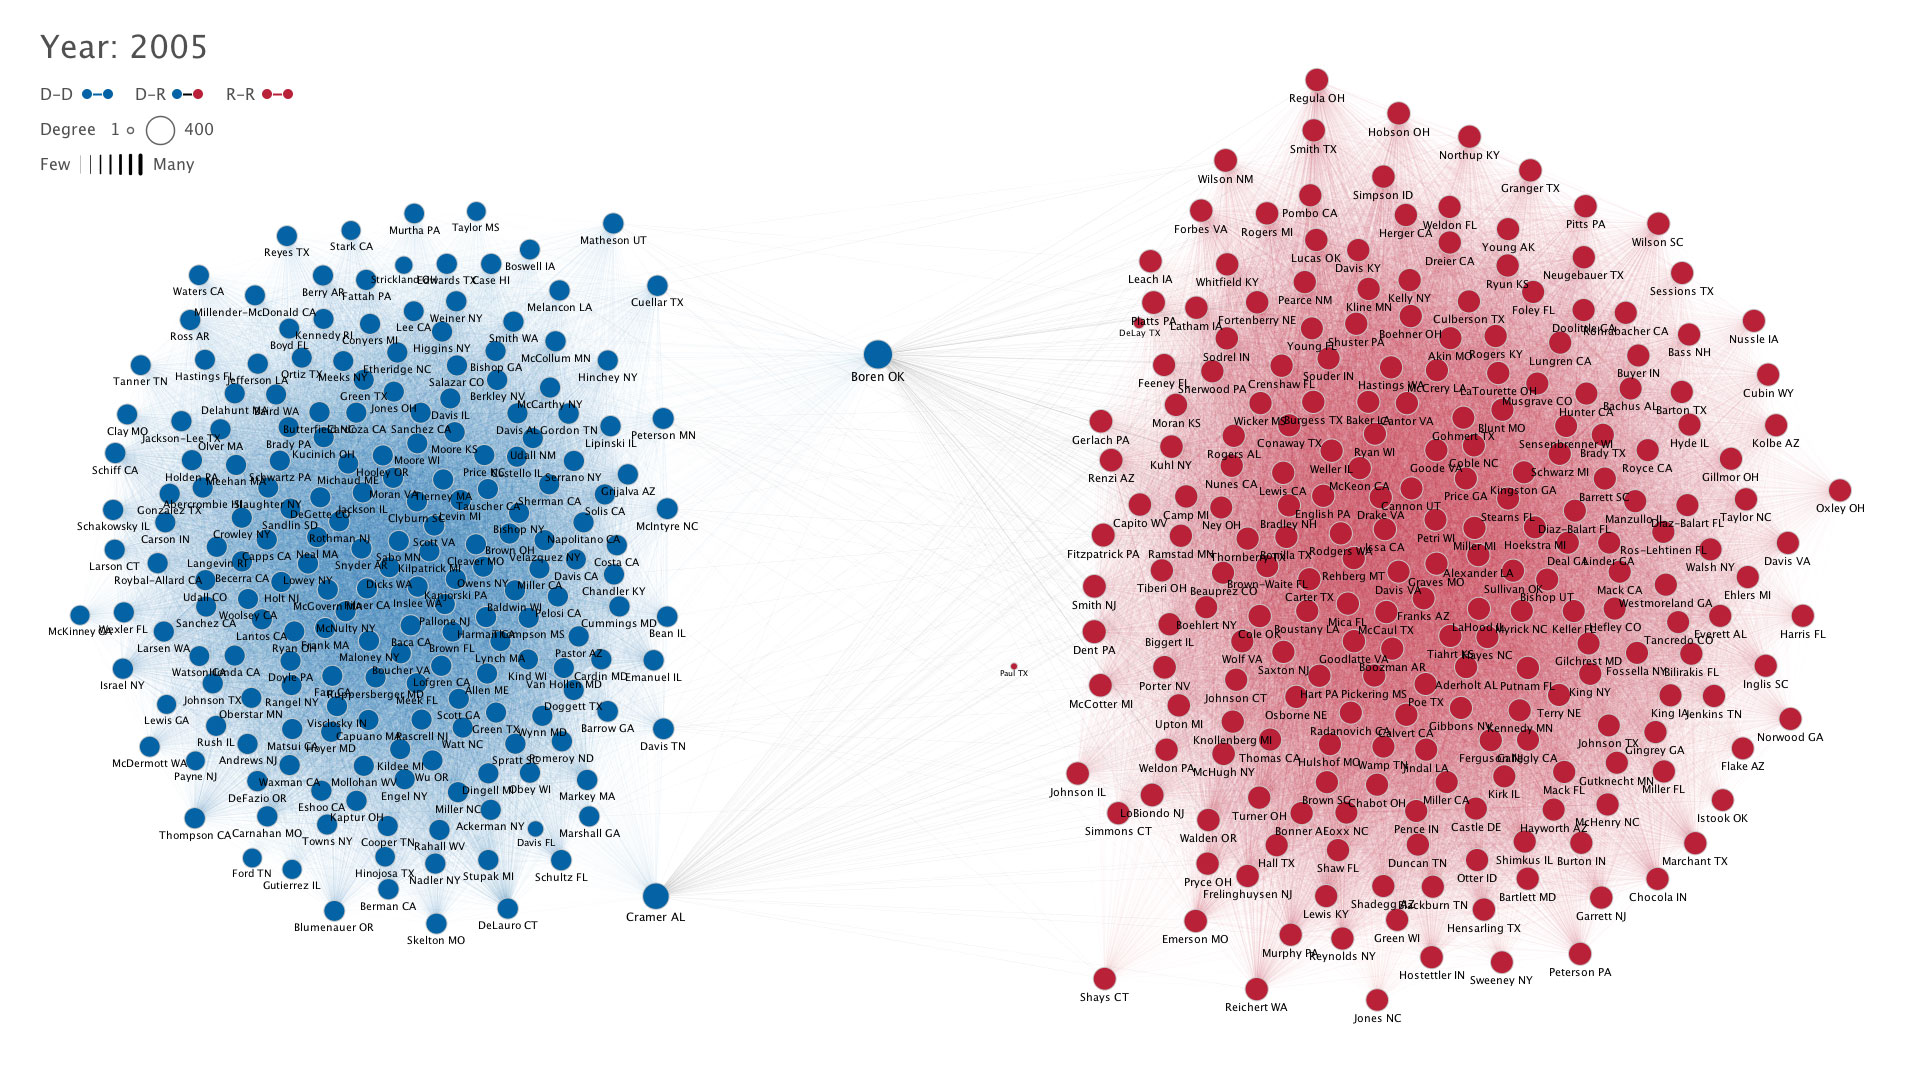
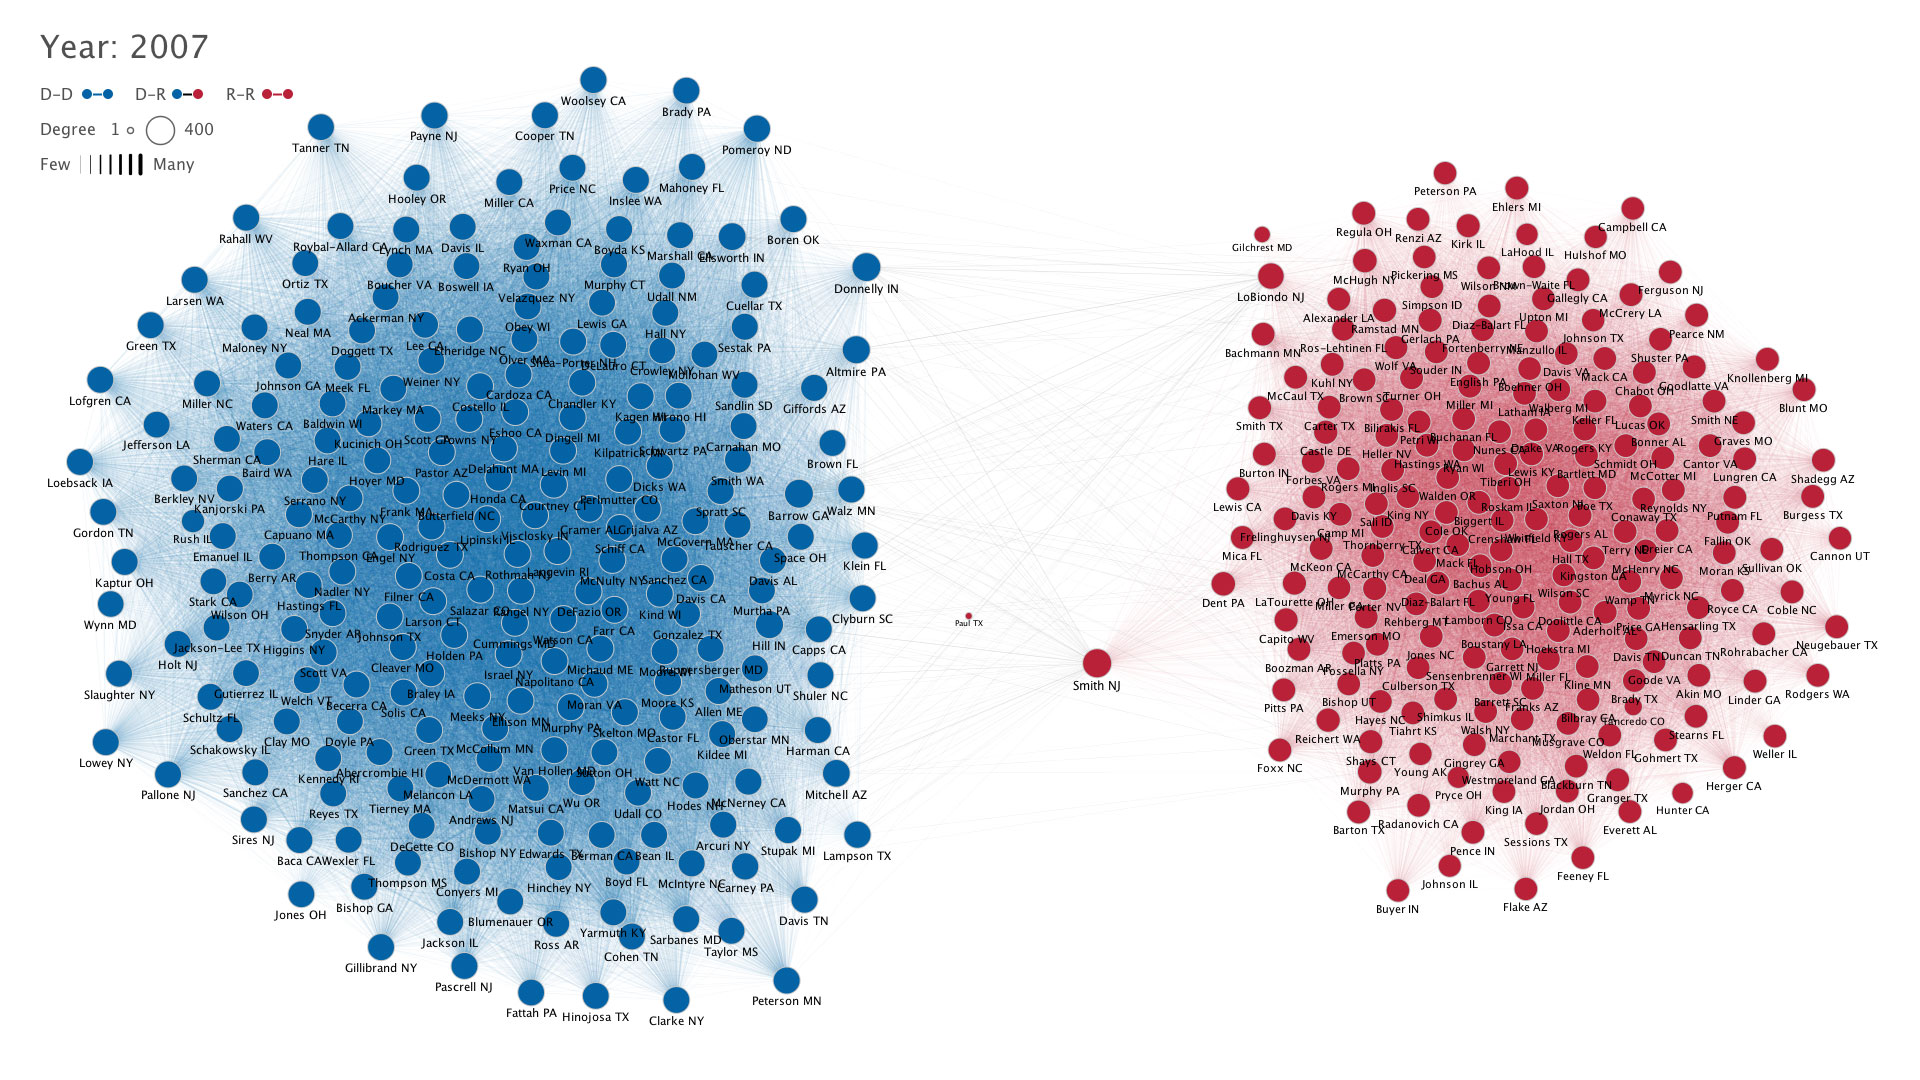
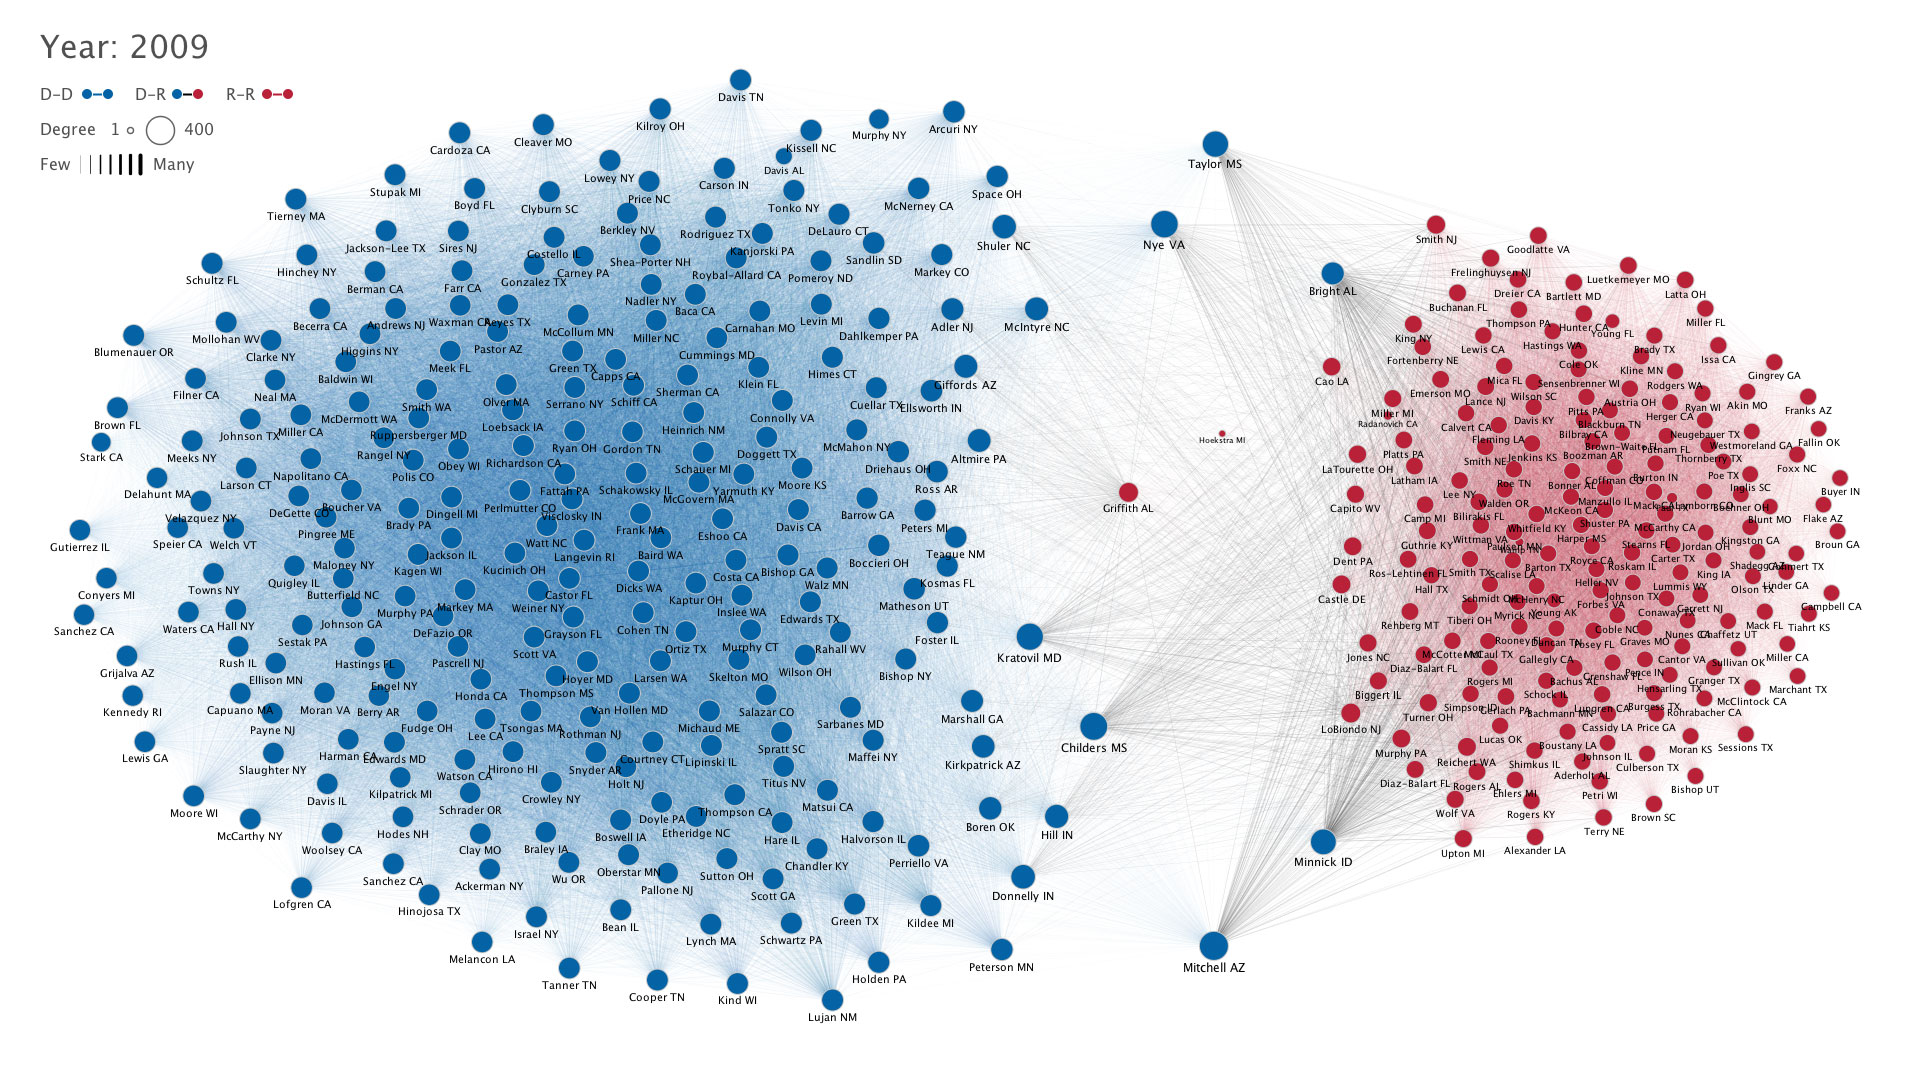
Political polarization in the U.S. Congress has been a topic of much discussion recently. This visualization shows the party polarization of the House of Representatives through time, with a focus on which members continue to participate across party lines—such as southern Democrats from Alabama, Mississippi, Texas and Louisiana cooperating with many Republican voters in the late 1990's and 2000's.
How to Read the Networks
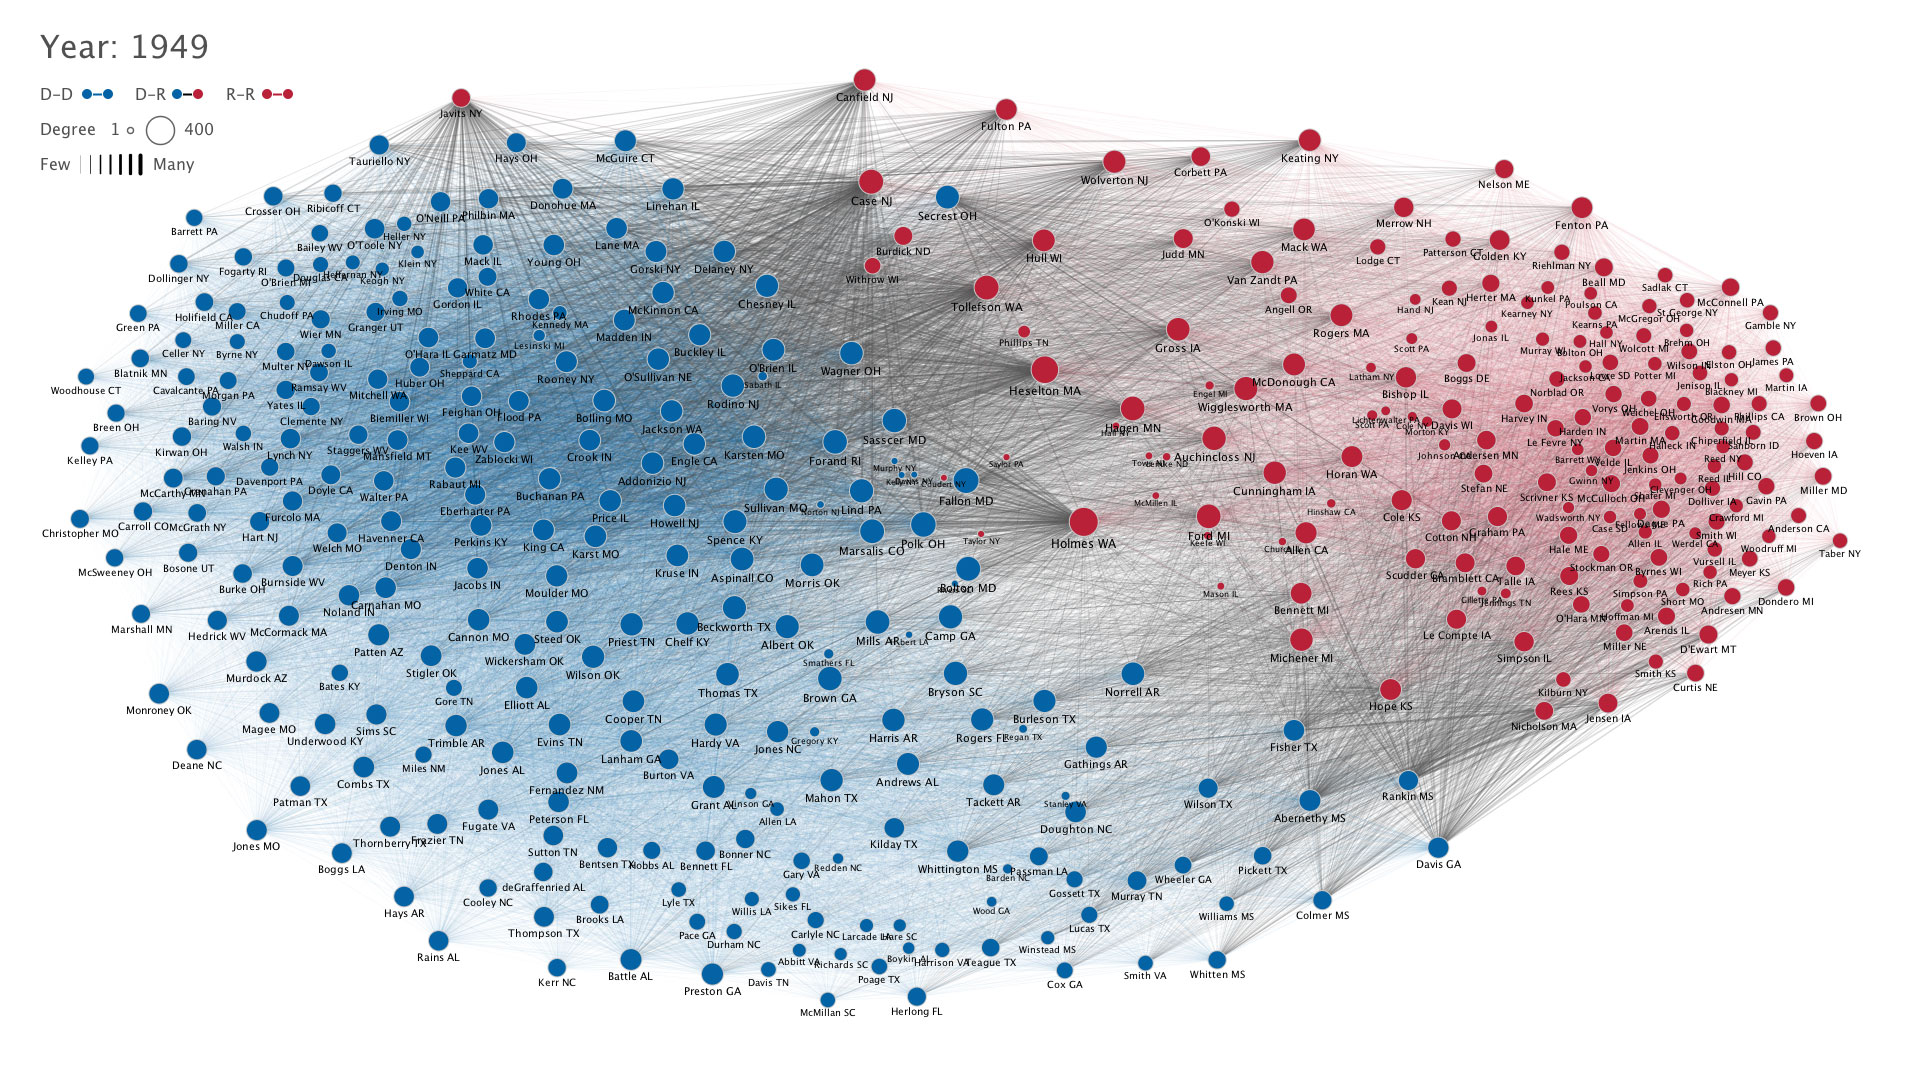
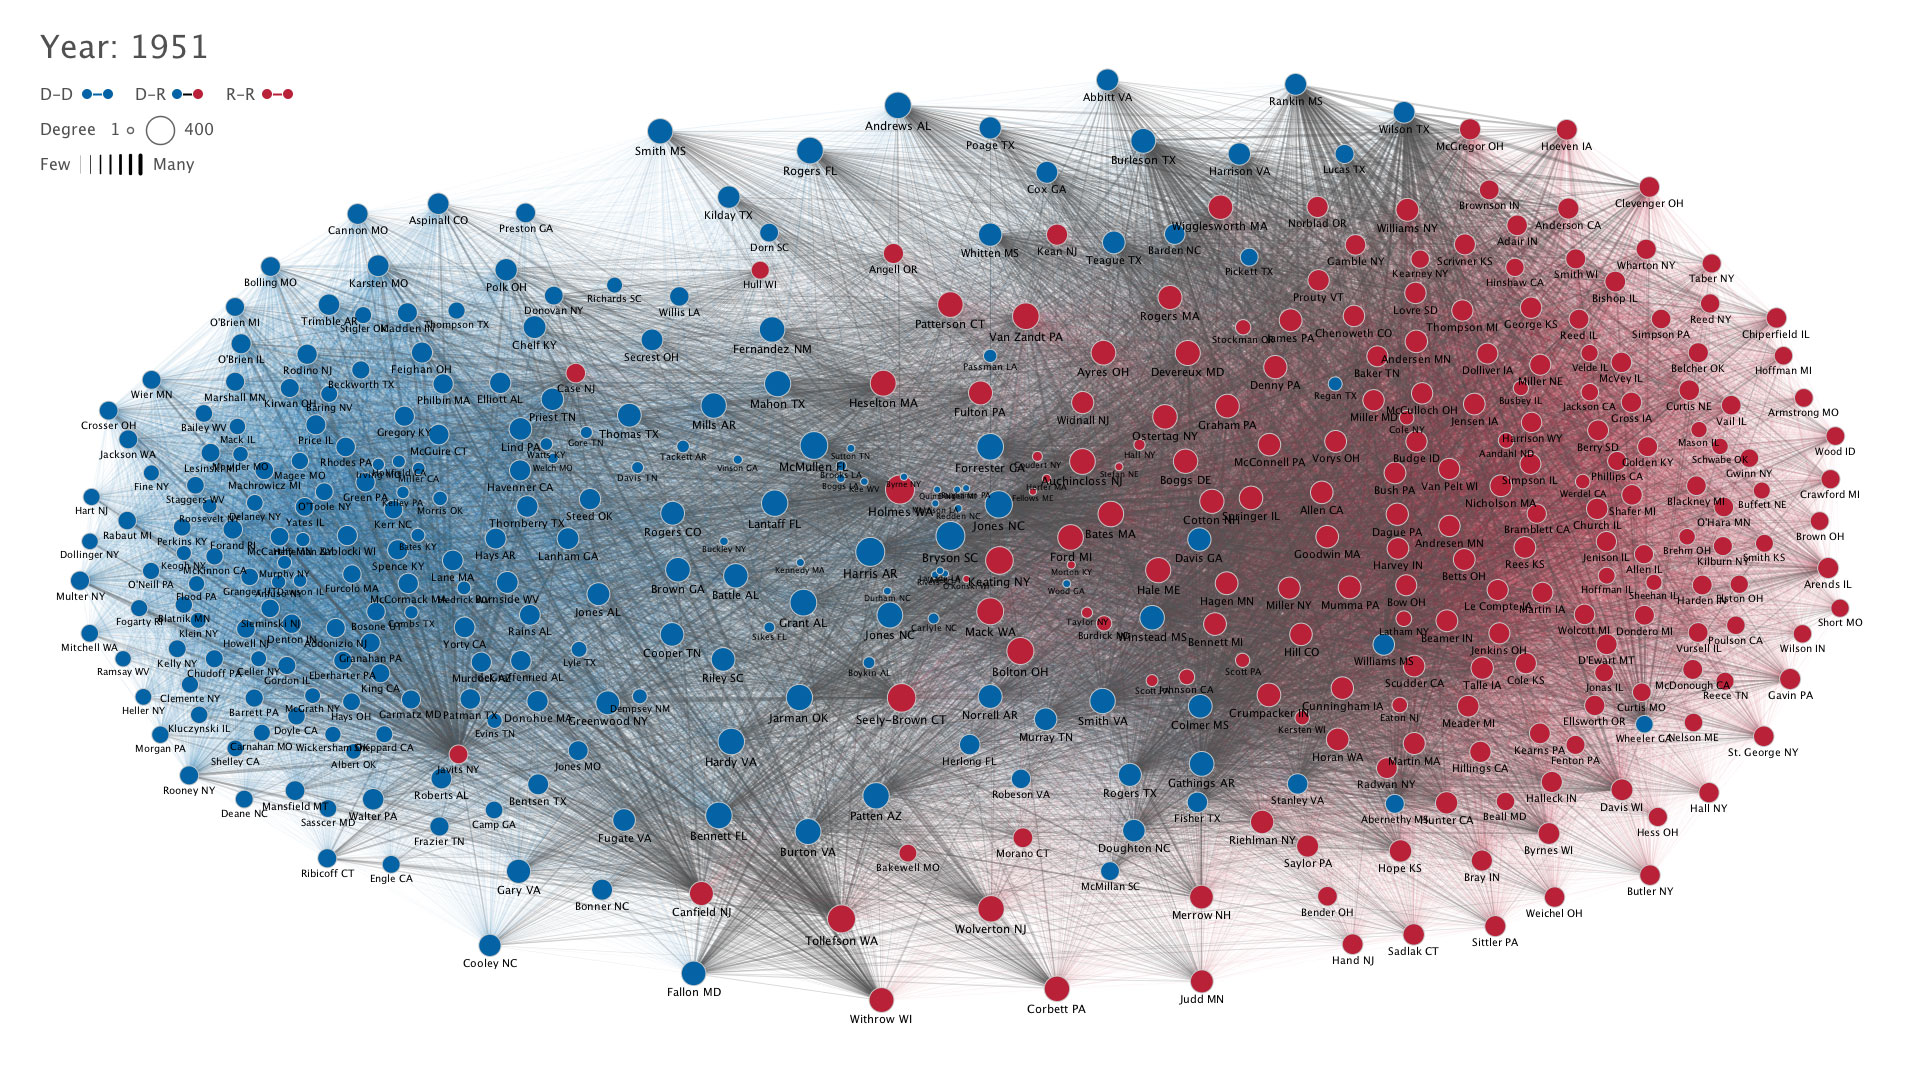
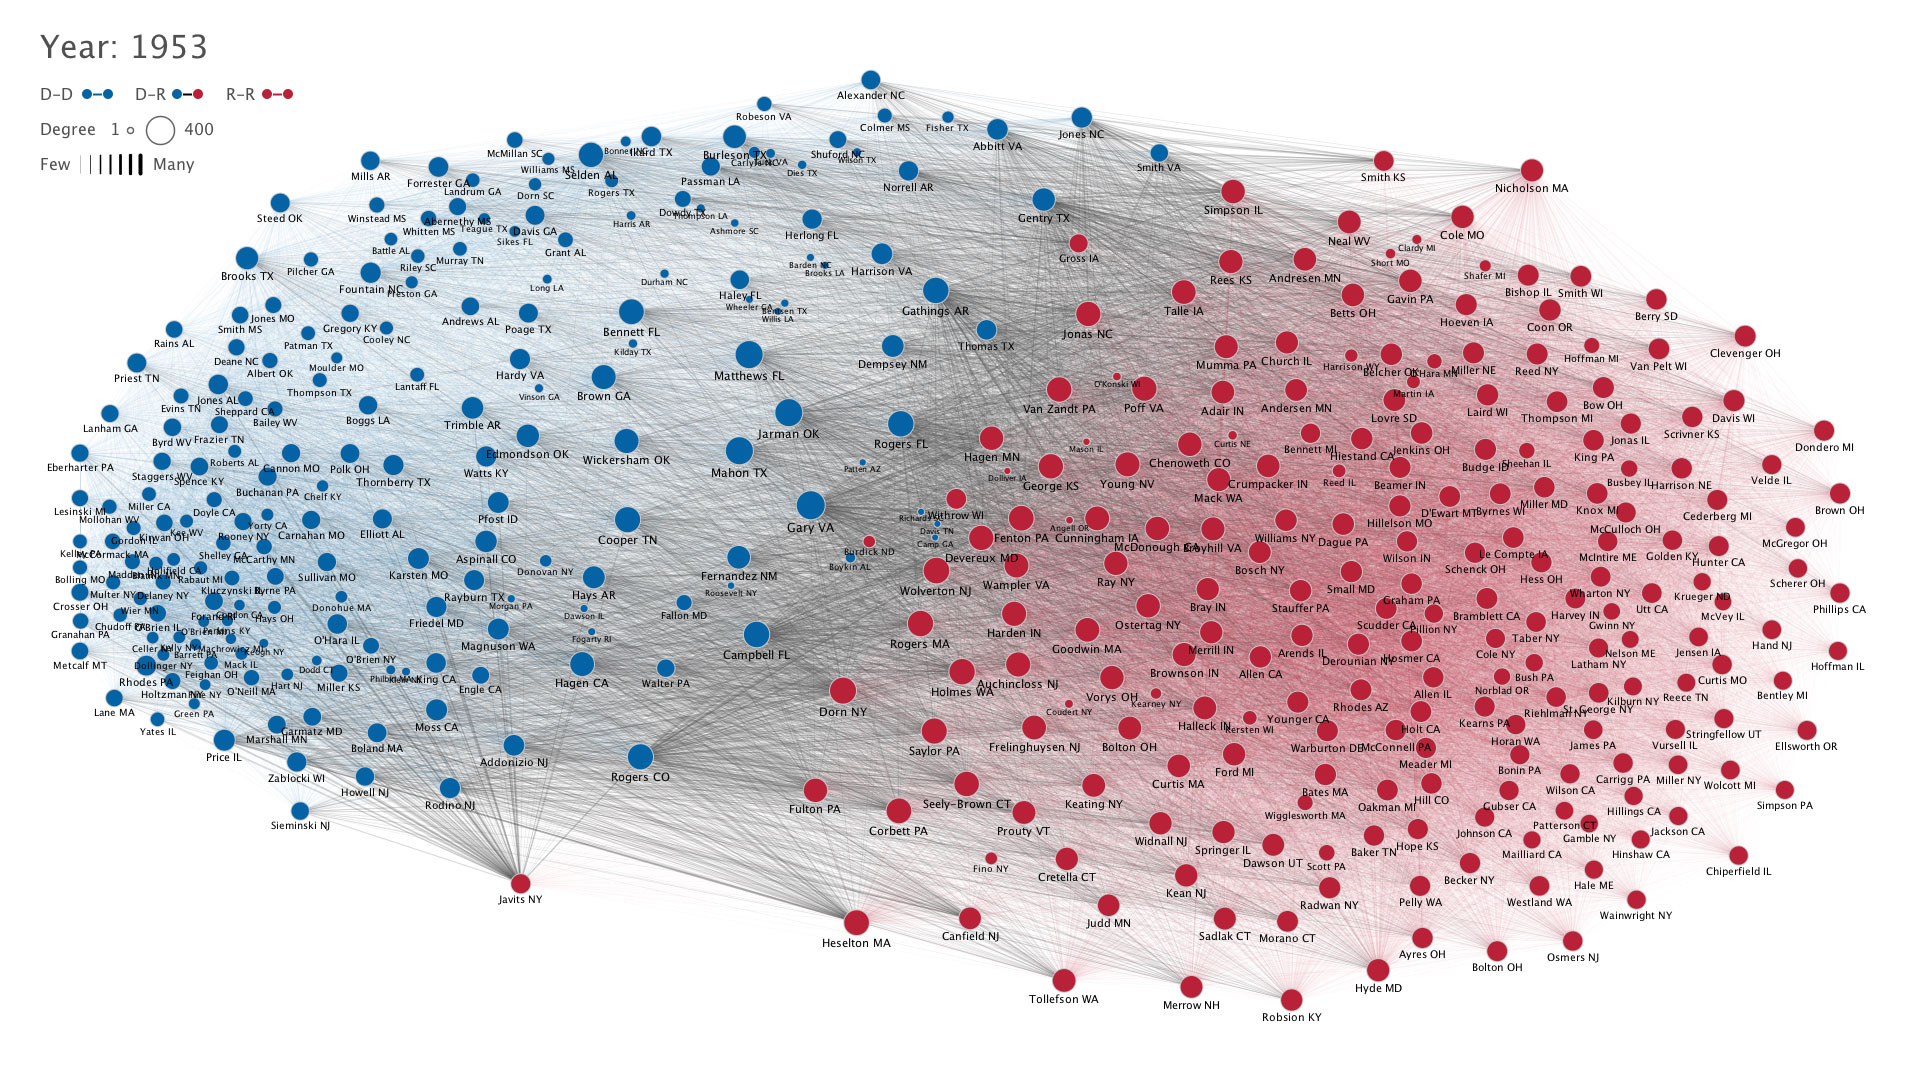
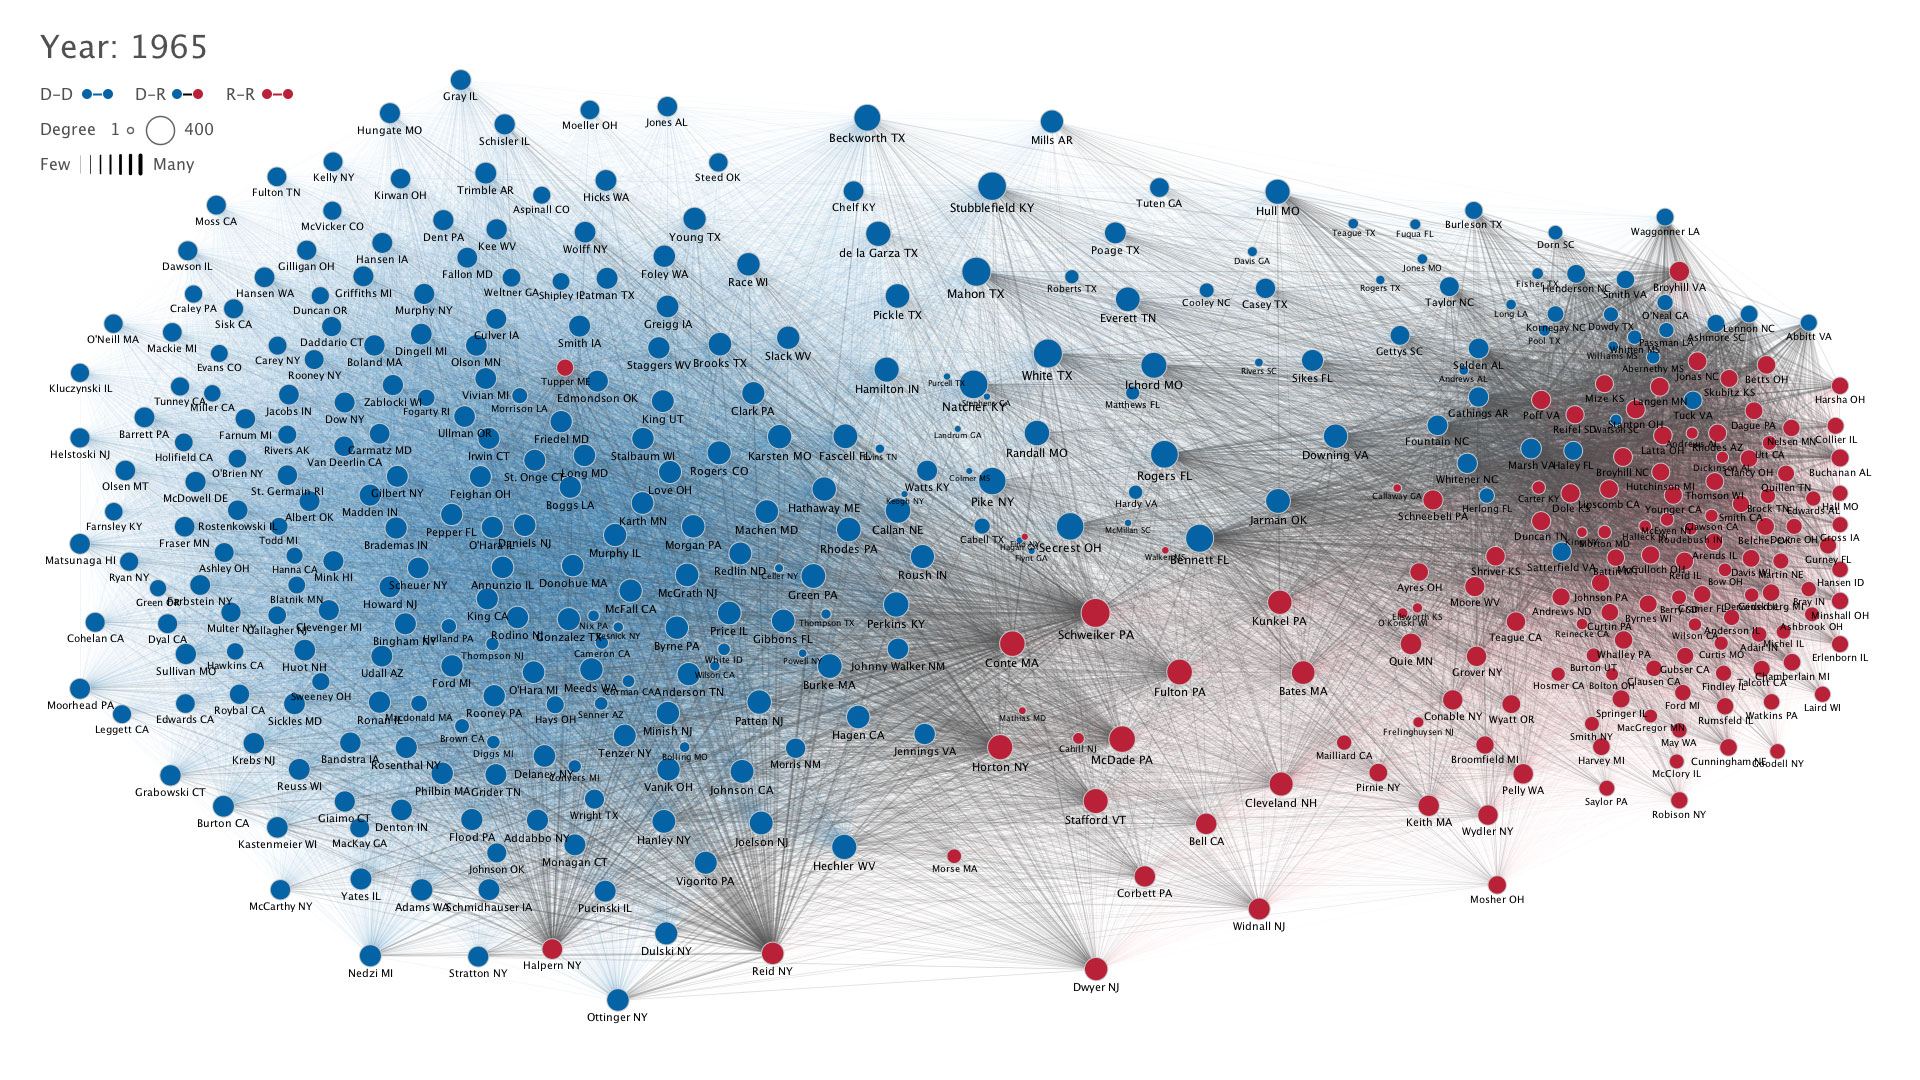
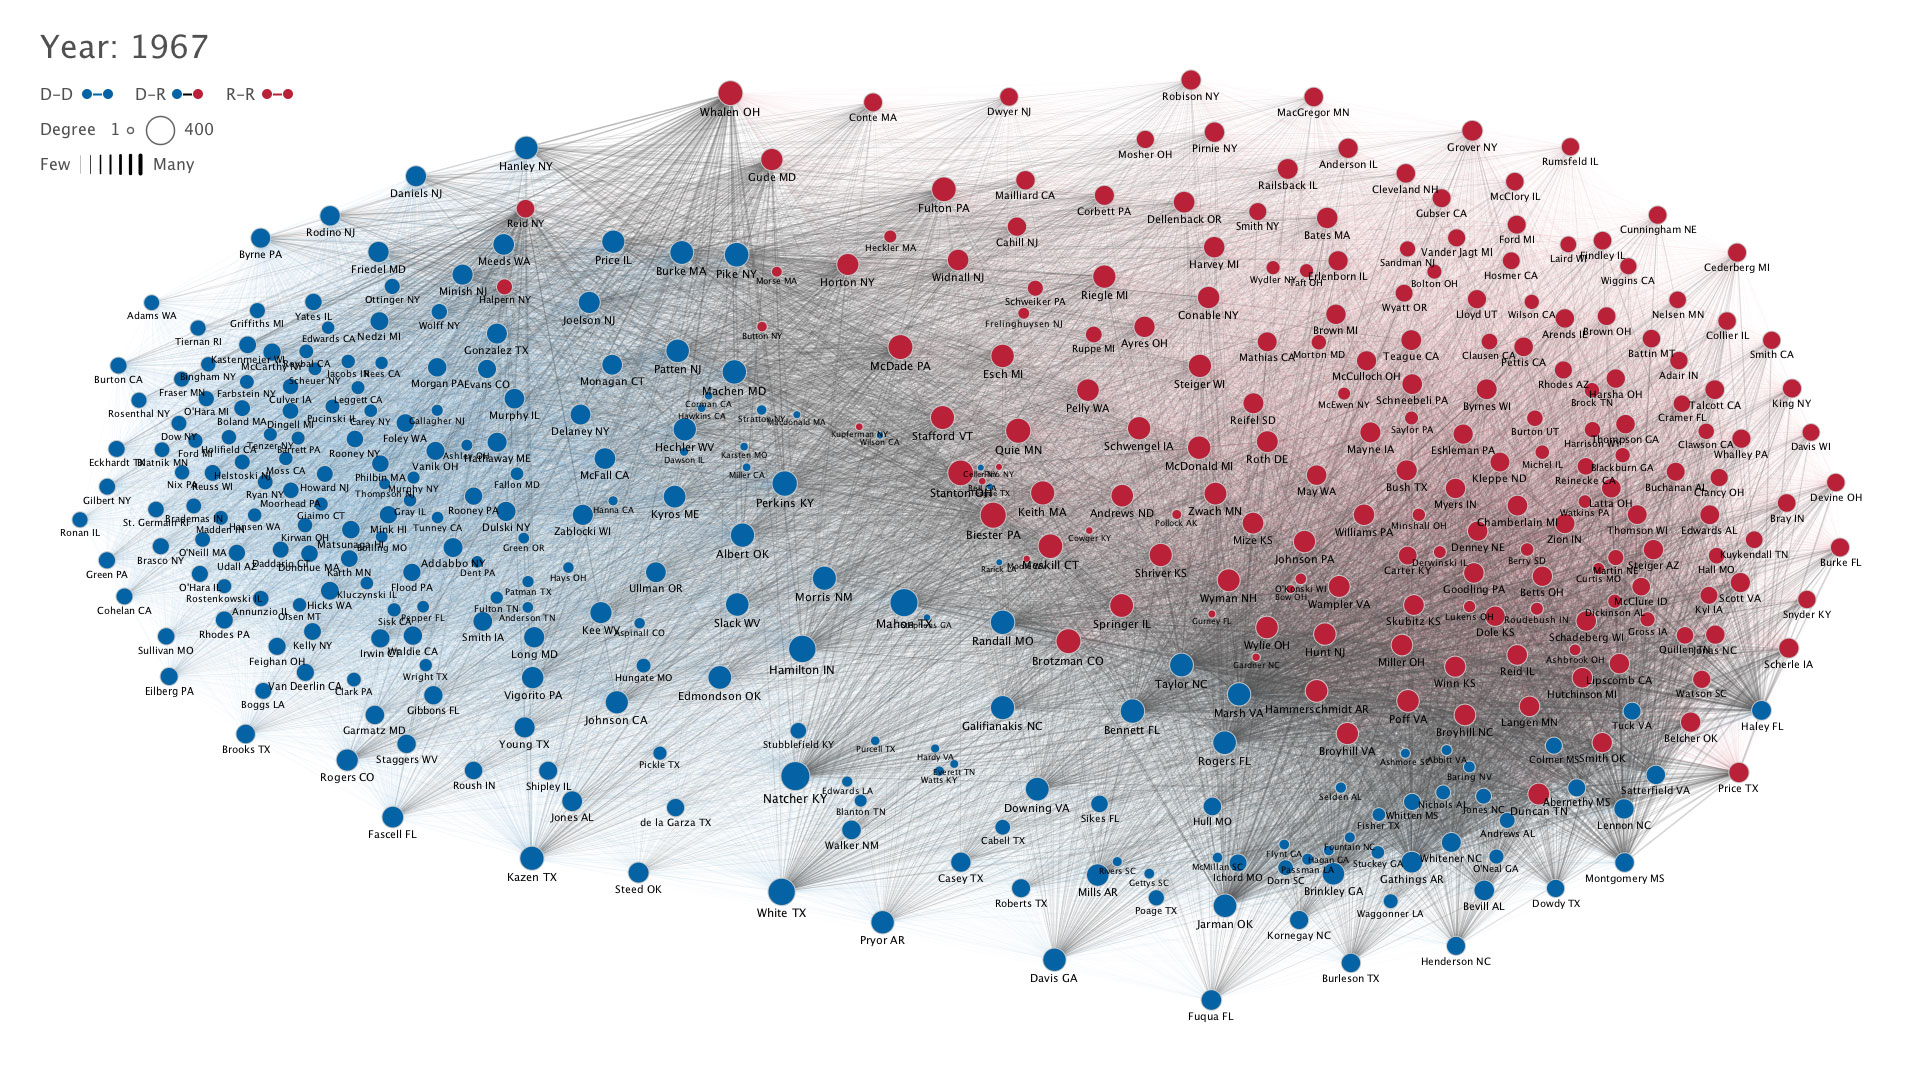
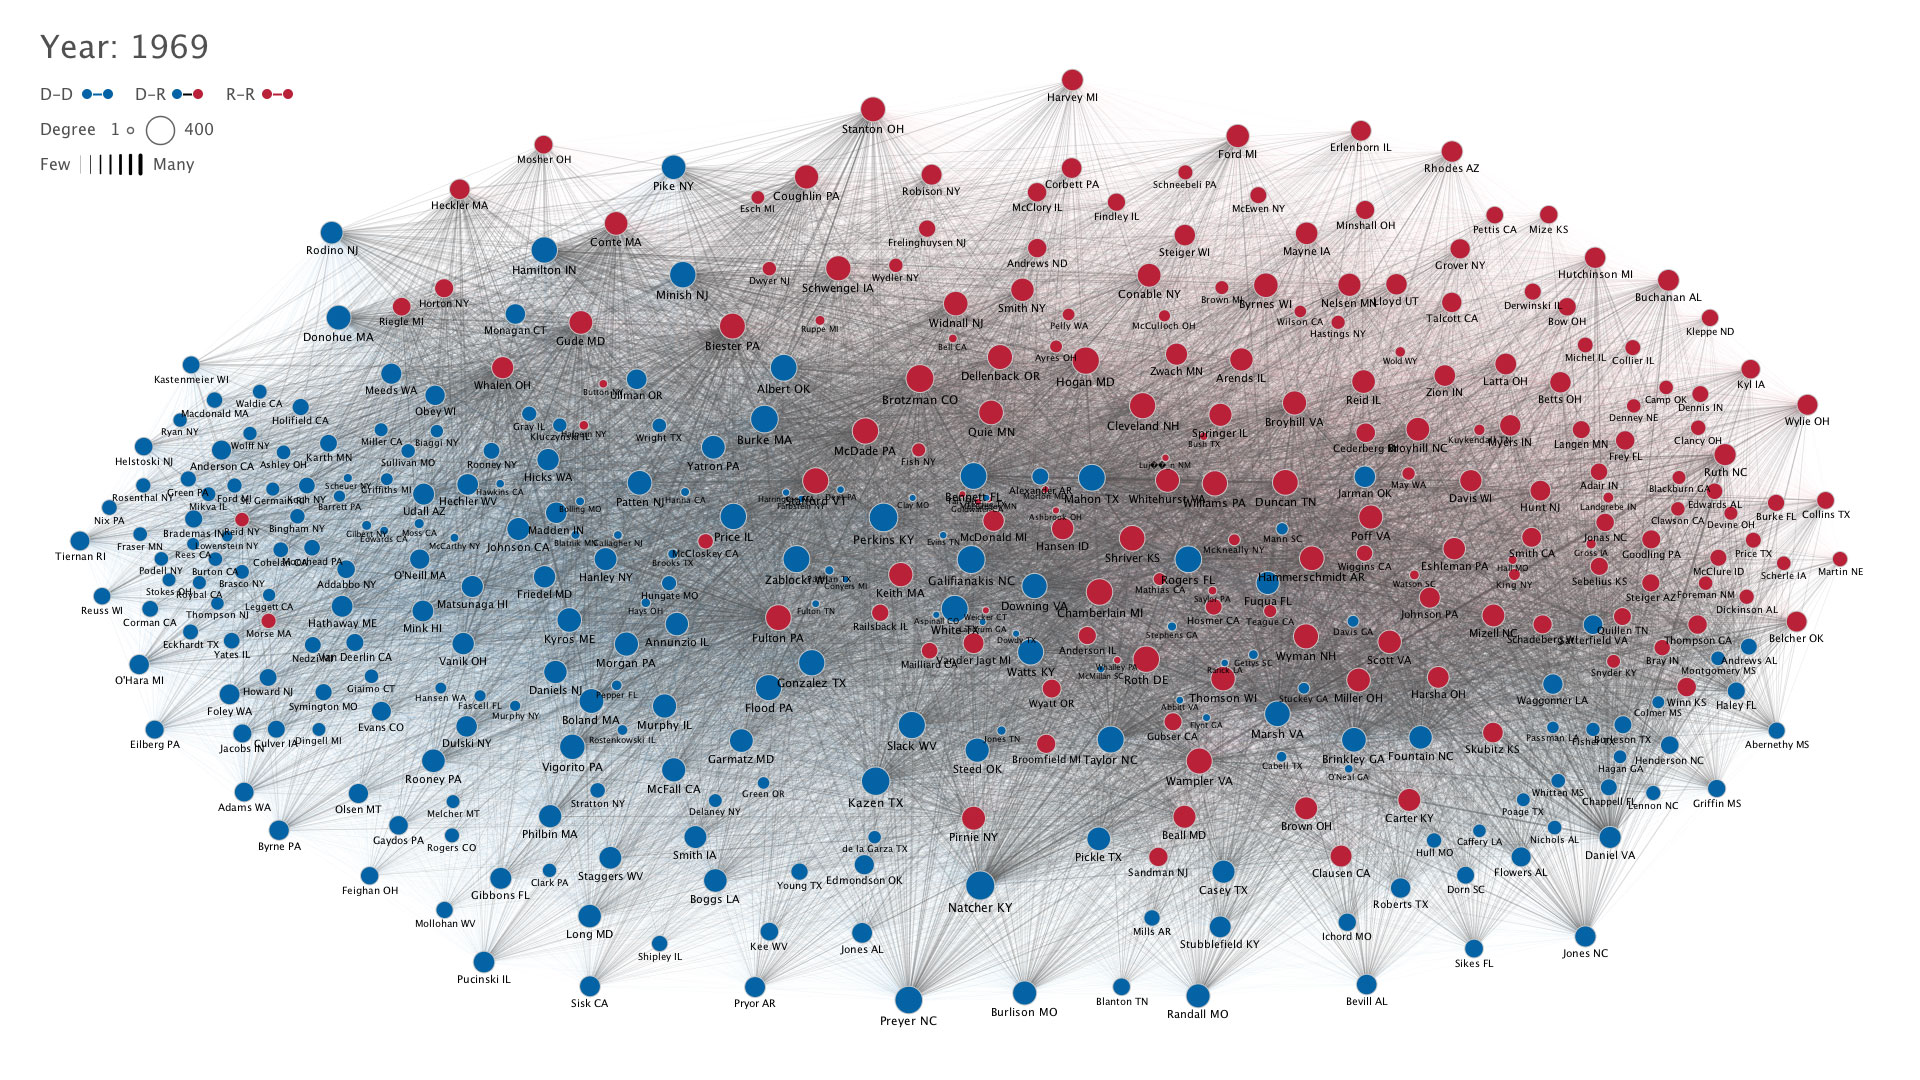
Each member of the U.S. House of Representatives from 1949–2012 is drawn as a single node. Republican (R) representatives are in red and Democrat (D) representatives are in blue. Edges between nodes are drawn if each member agrees with another member more often than the "threshold value" of votes specific to that particular Congress.
The threshold value is the number of agreements where any pair exhibiting this number of agreements is equally likely to be comprised of two members of the same party (e.g. D-D or R-R), or a cross-party pair (e.g. D-R). Each node is made bigger or smaller based on the number of connections it has. Edges are thicker if the pair agrees on more votes.
The network is drawn using a linear-attraction linear-repulsion model with Barnes Hut optimization.
Interactive Networks by Year (1949–2011)
Publication & Press
From Data to Canvas: Luc Tuymans
An Appropriationist Dialogue
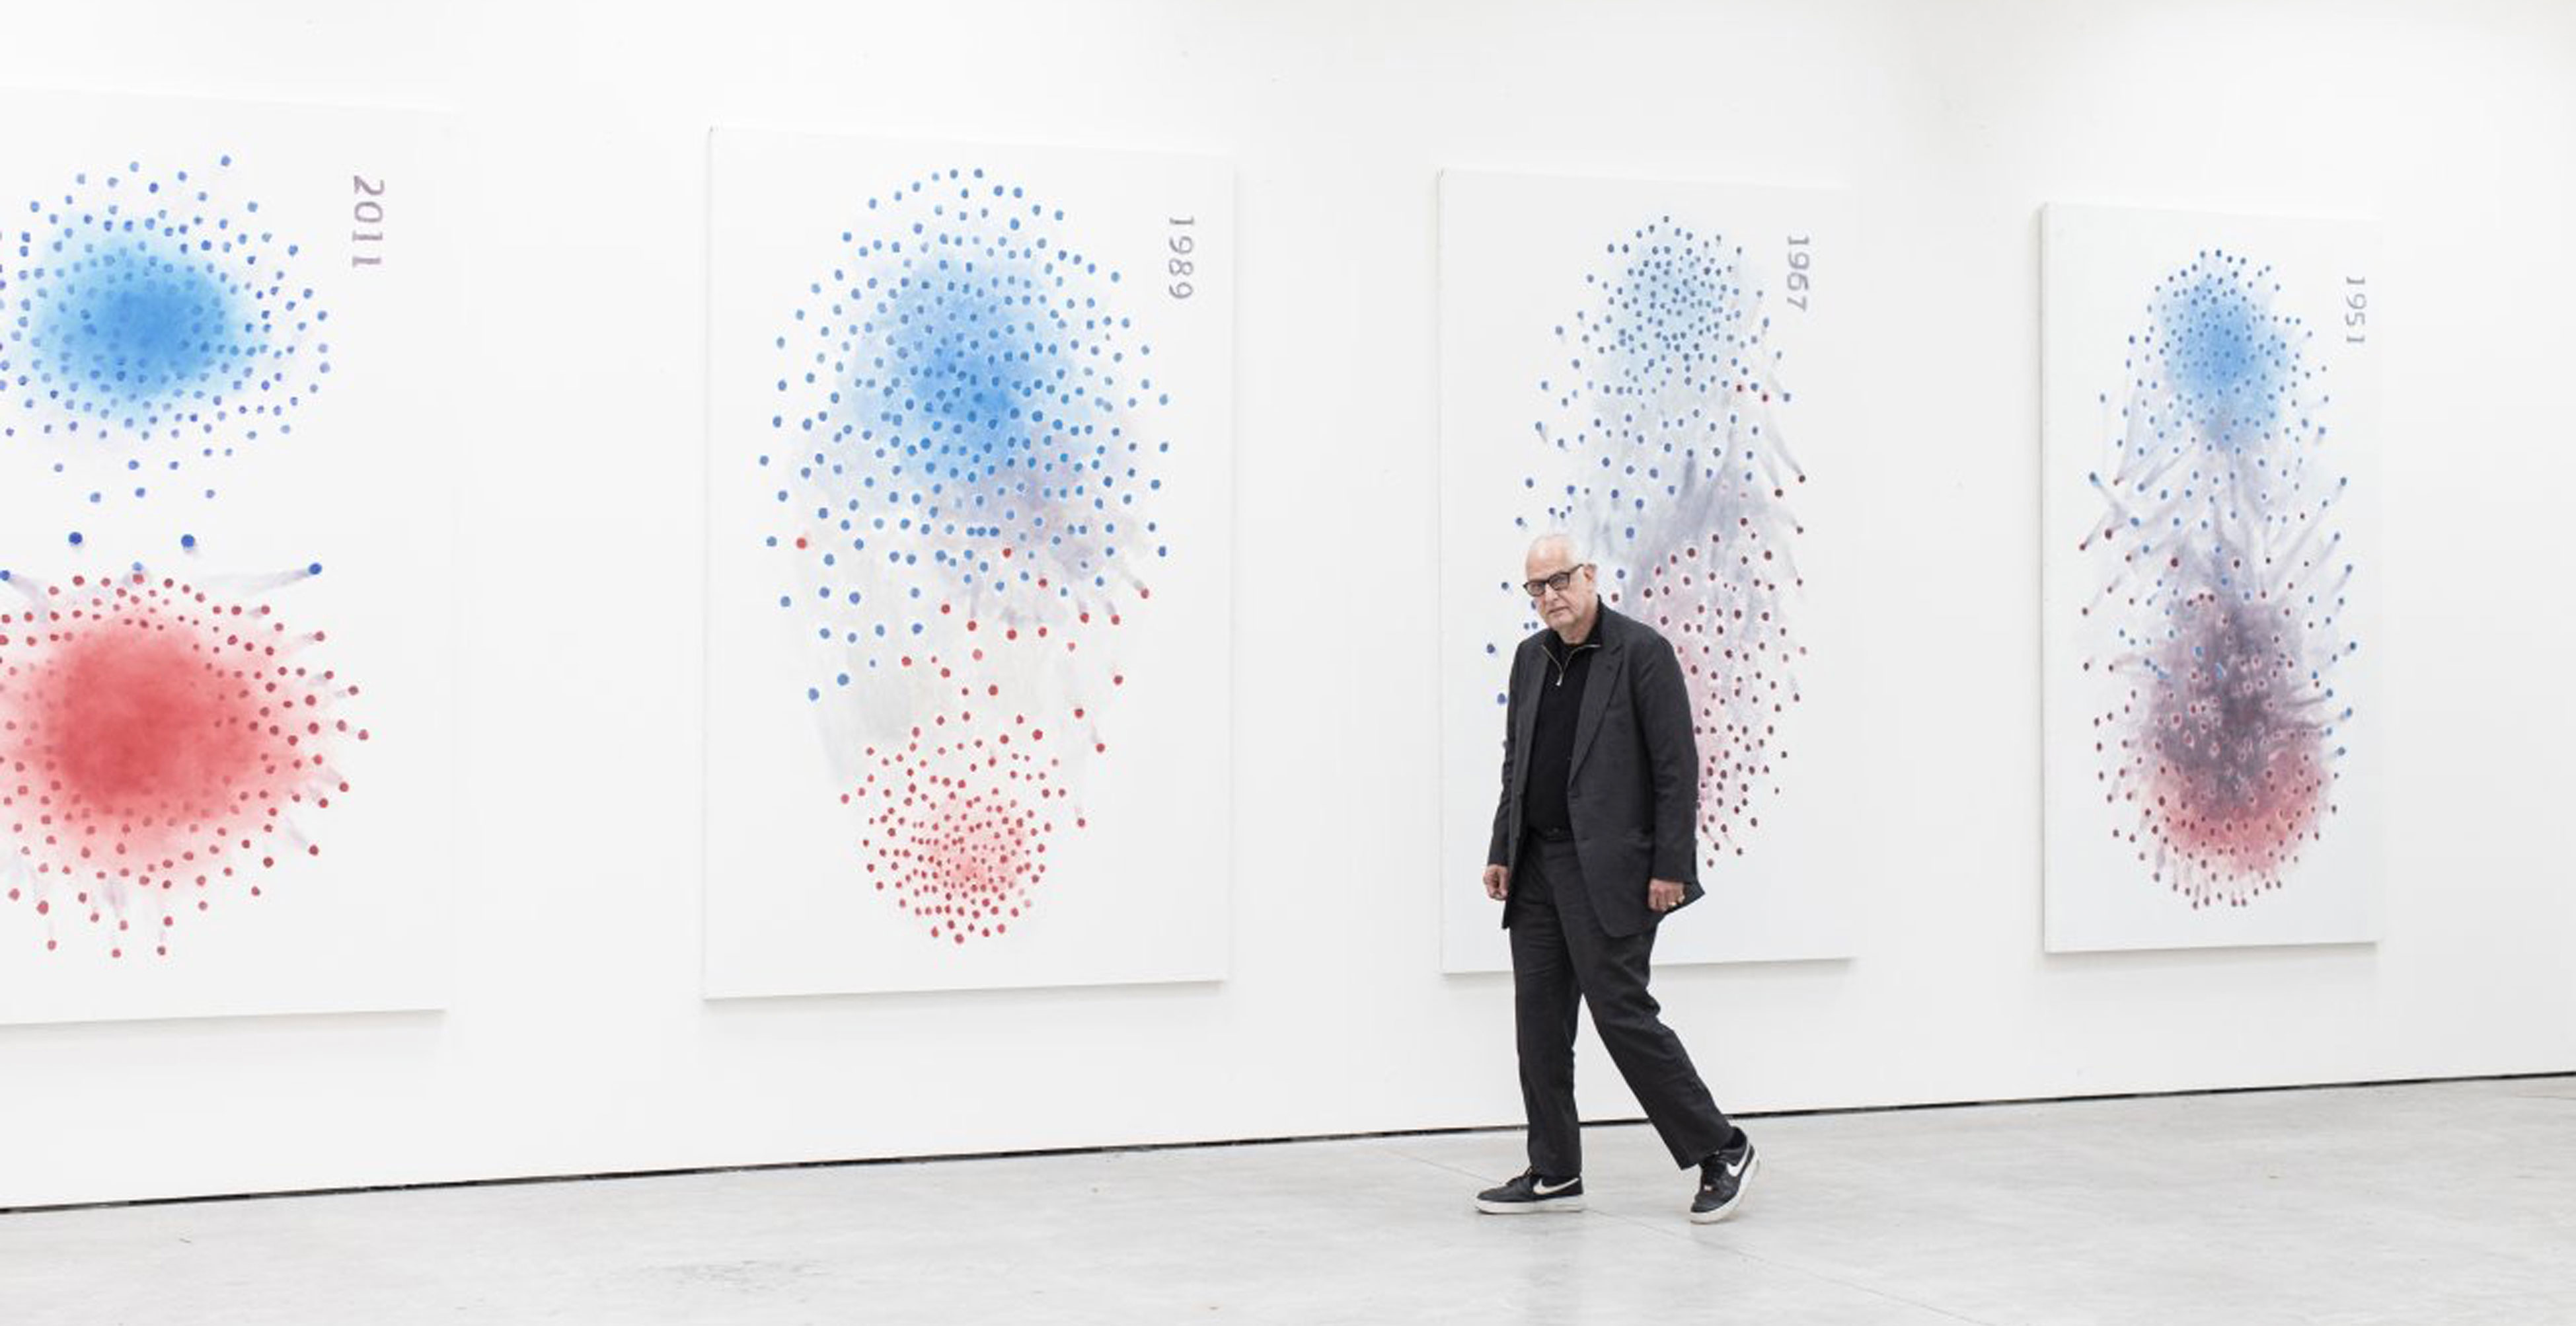
In 2021, Belgian painter Luc Tuymans—one of the most influential contemporary artists working today—transformed this data visualization into a monumental oil painting titled Polarisation – Based on a data visualization by Mauro Martino.
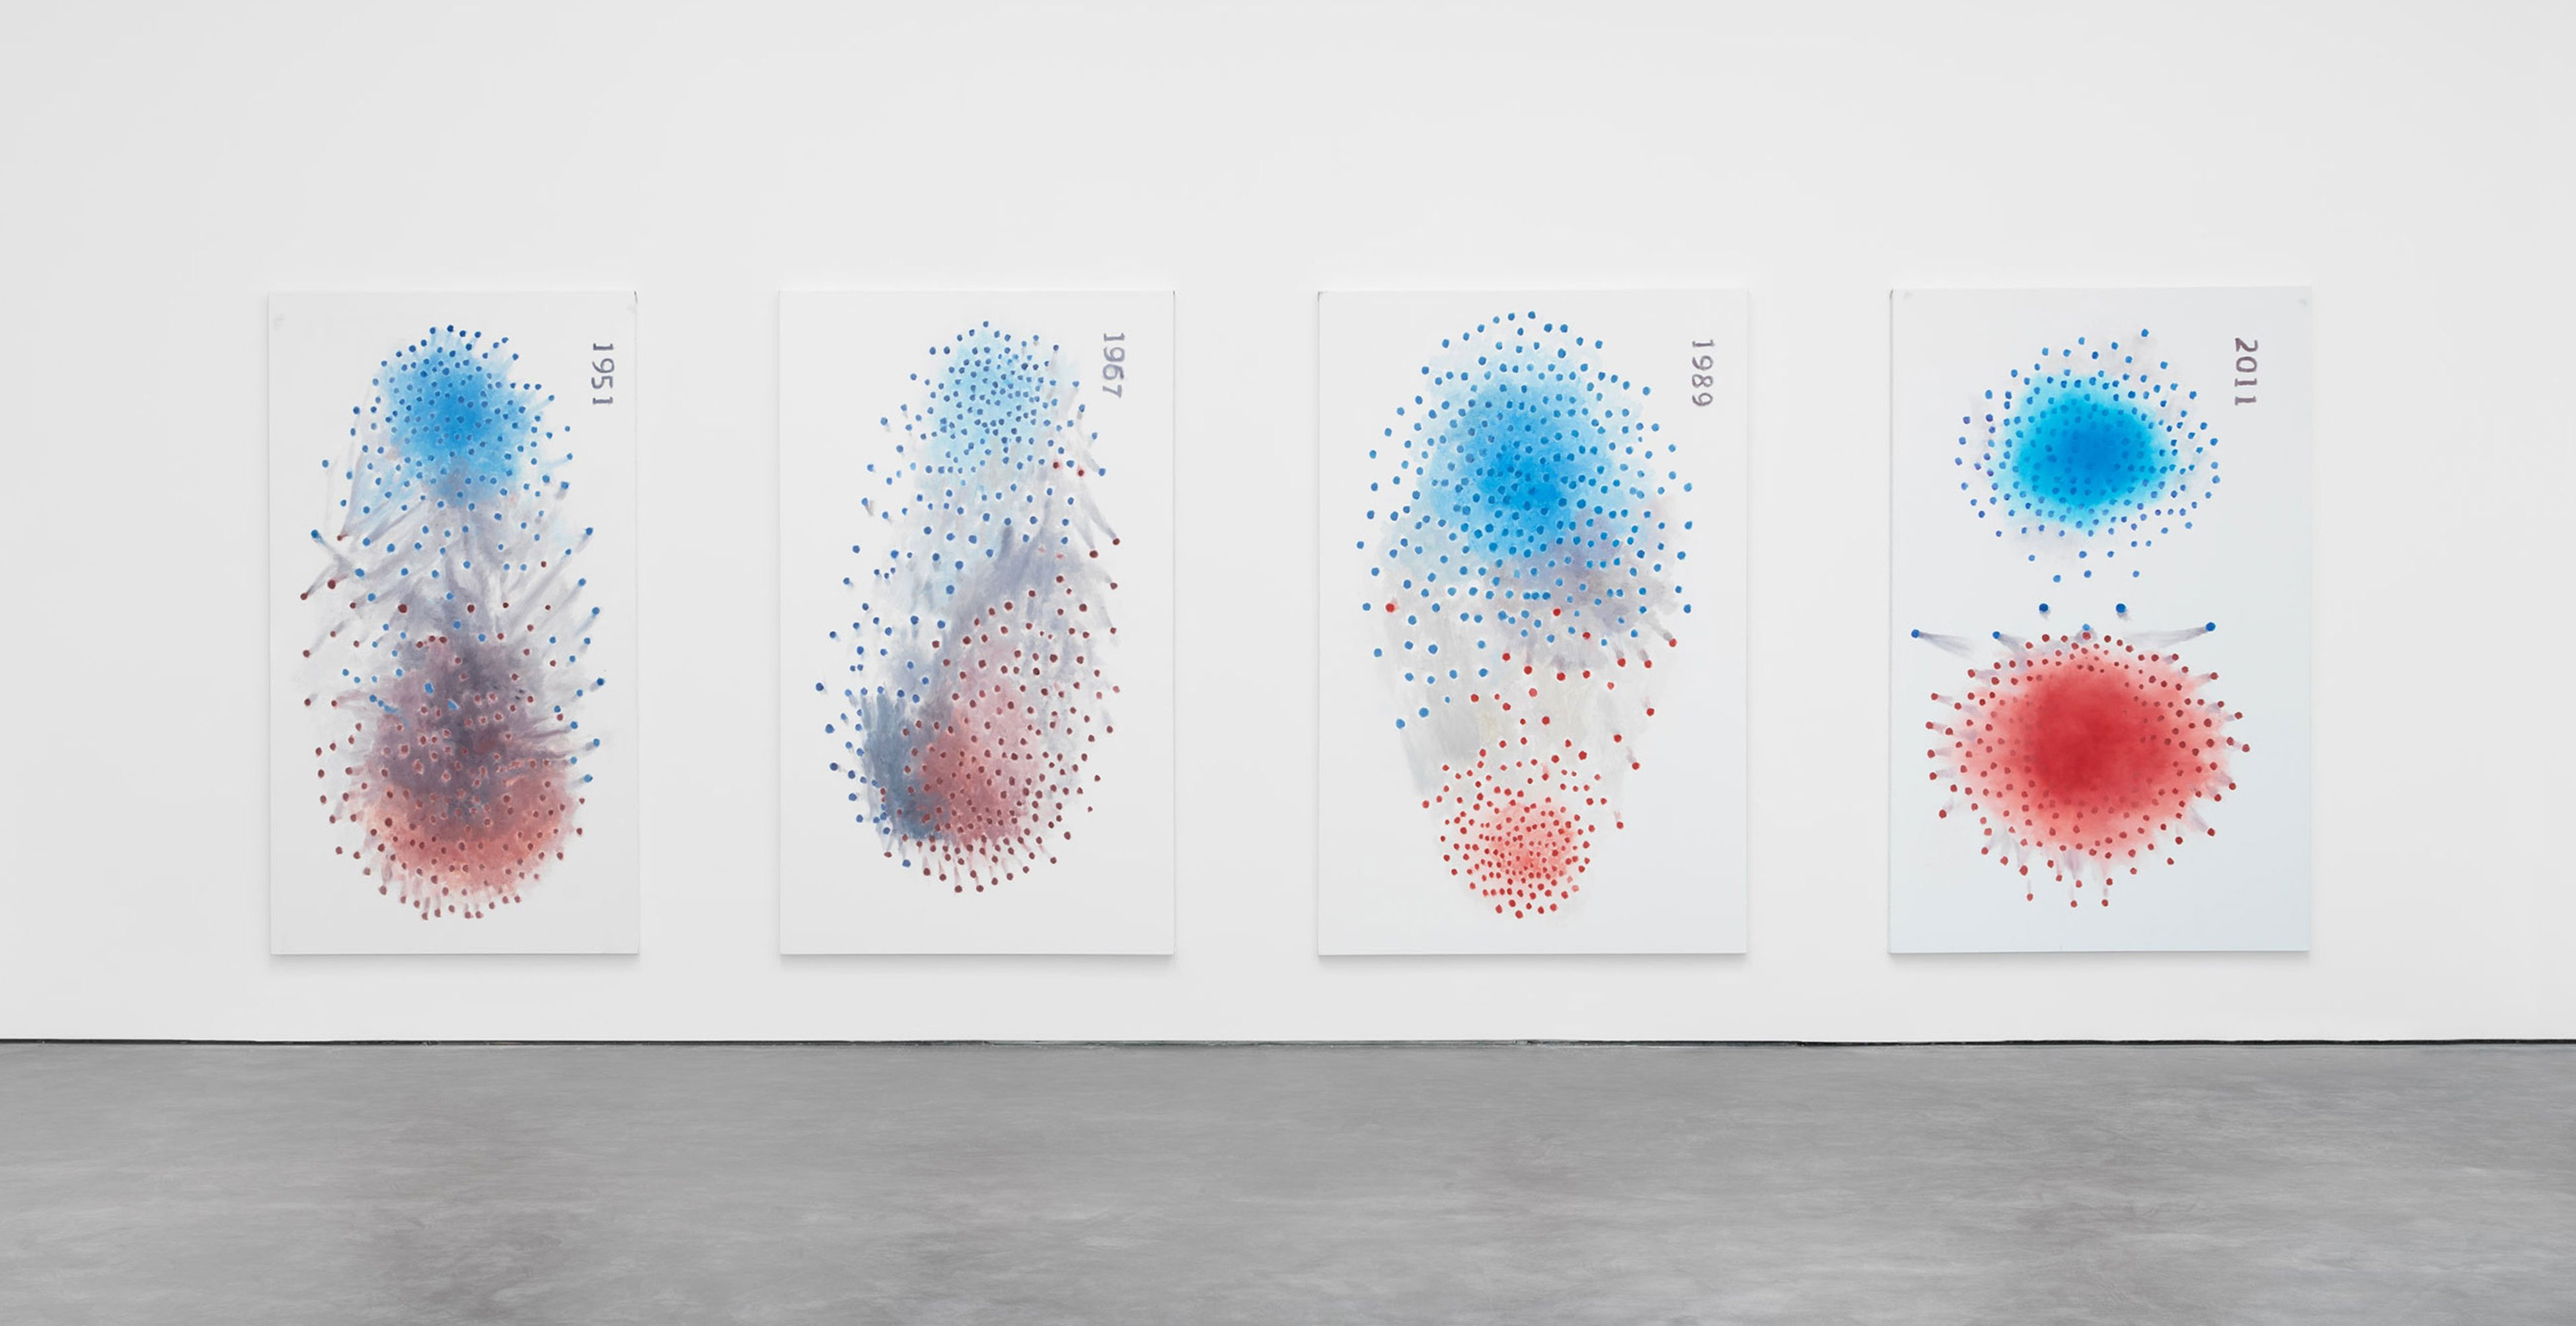
The work consists of four canvases, each nearly 2.5 meters tall, depicting the years 1951, 1967, 1989, and 2011. Tuymans rotated the original network diagrams by ninety degrees and rendered them by hand in oil, applying dots of paint to the canvas and spreading the pigment with his hands to create hazy, overlapping clouds of color.
The artistic operation belongs to a lineage of appropriationist practice in contemporary art—from Andy Warhol's media images to Sherrie Levine's rephotographed masterworks, from Gerhard Richter's photo-paintings to Richard Prince's re-presented advertisements. In each case, the act of translation—changing medium, scale, or context—generates new meaning.
What distinguishes Tuymans's gesture is its transparency: the title itself is an explicit act of attribution, a declared dialogue between data science and fine art, between the algorithmic and the handmade, between information and contemplation.
The work debuted at David Zwirner gallery in Paris (2022) and is now part of the permanent collection at Glenstone Museum in Potomac, Maryland.
 Luc Tuymans, Polarisation, 2021
. Oil on canvas, four panels. David Zwirner
Luc Tuymans, Polarisation, 2021
Luc Tuymans, Polarisation, 2021. Oil on canvas, four panels. David Zwirner
 Installation view, David Zwirner, Paris, 2022
Installation view, David Zwirner, Paris, 2022
Installation view, David Zwirner, Paris, 2022
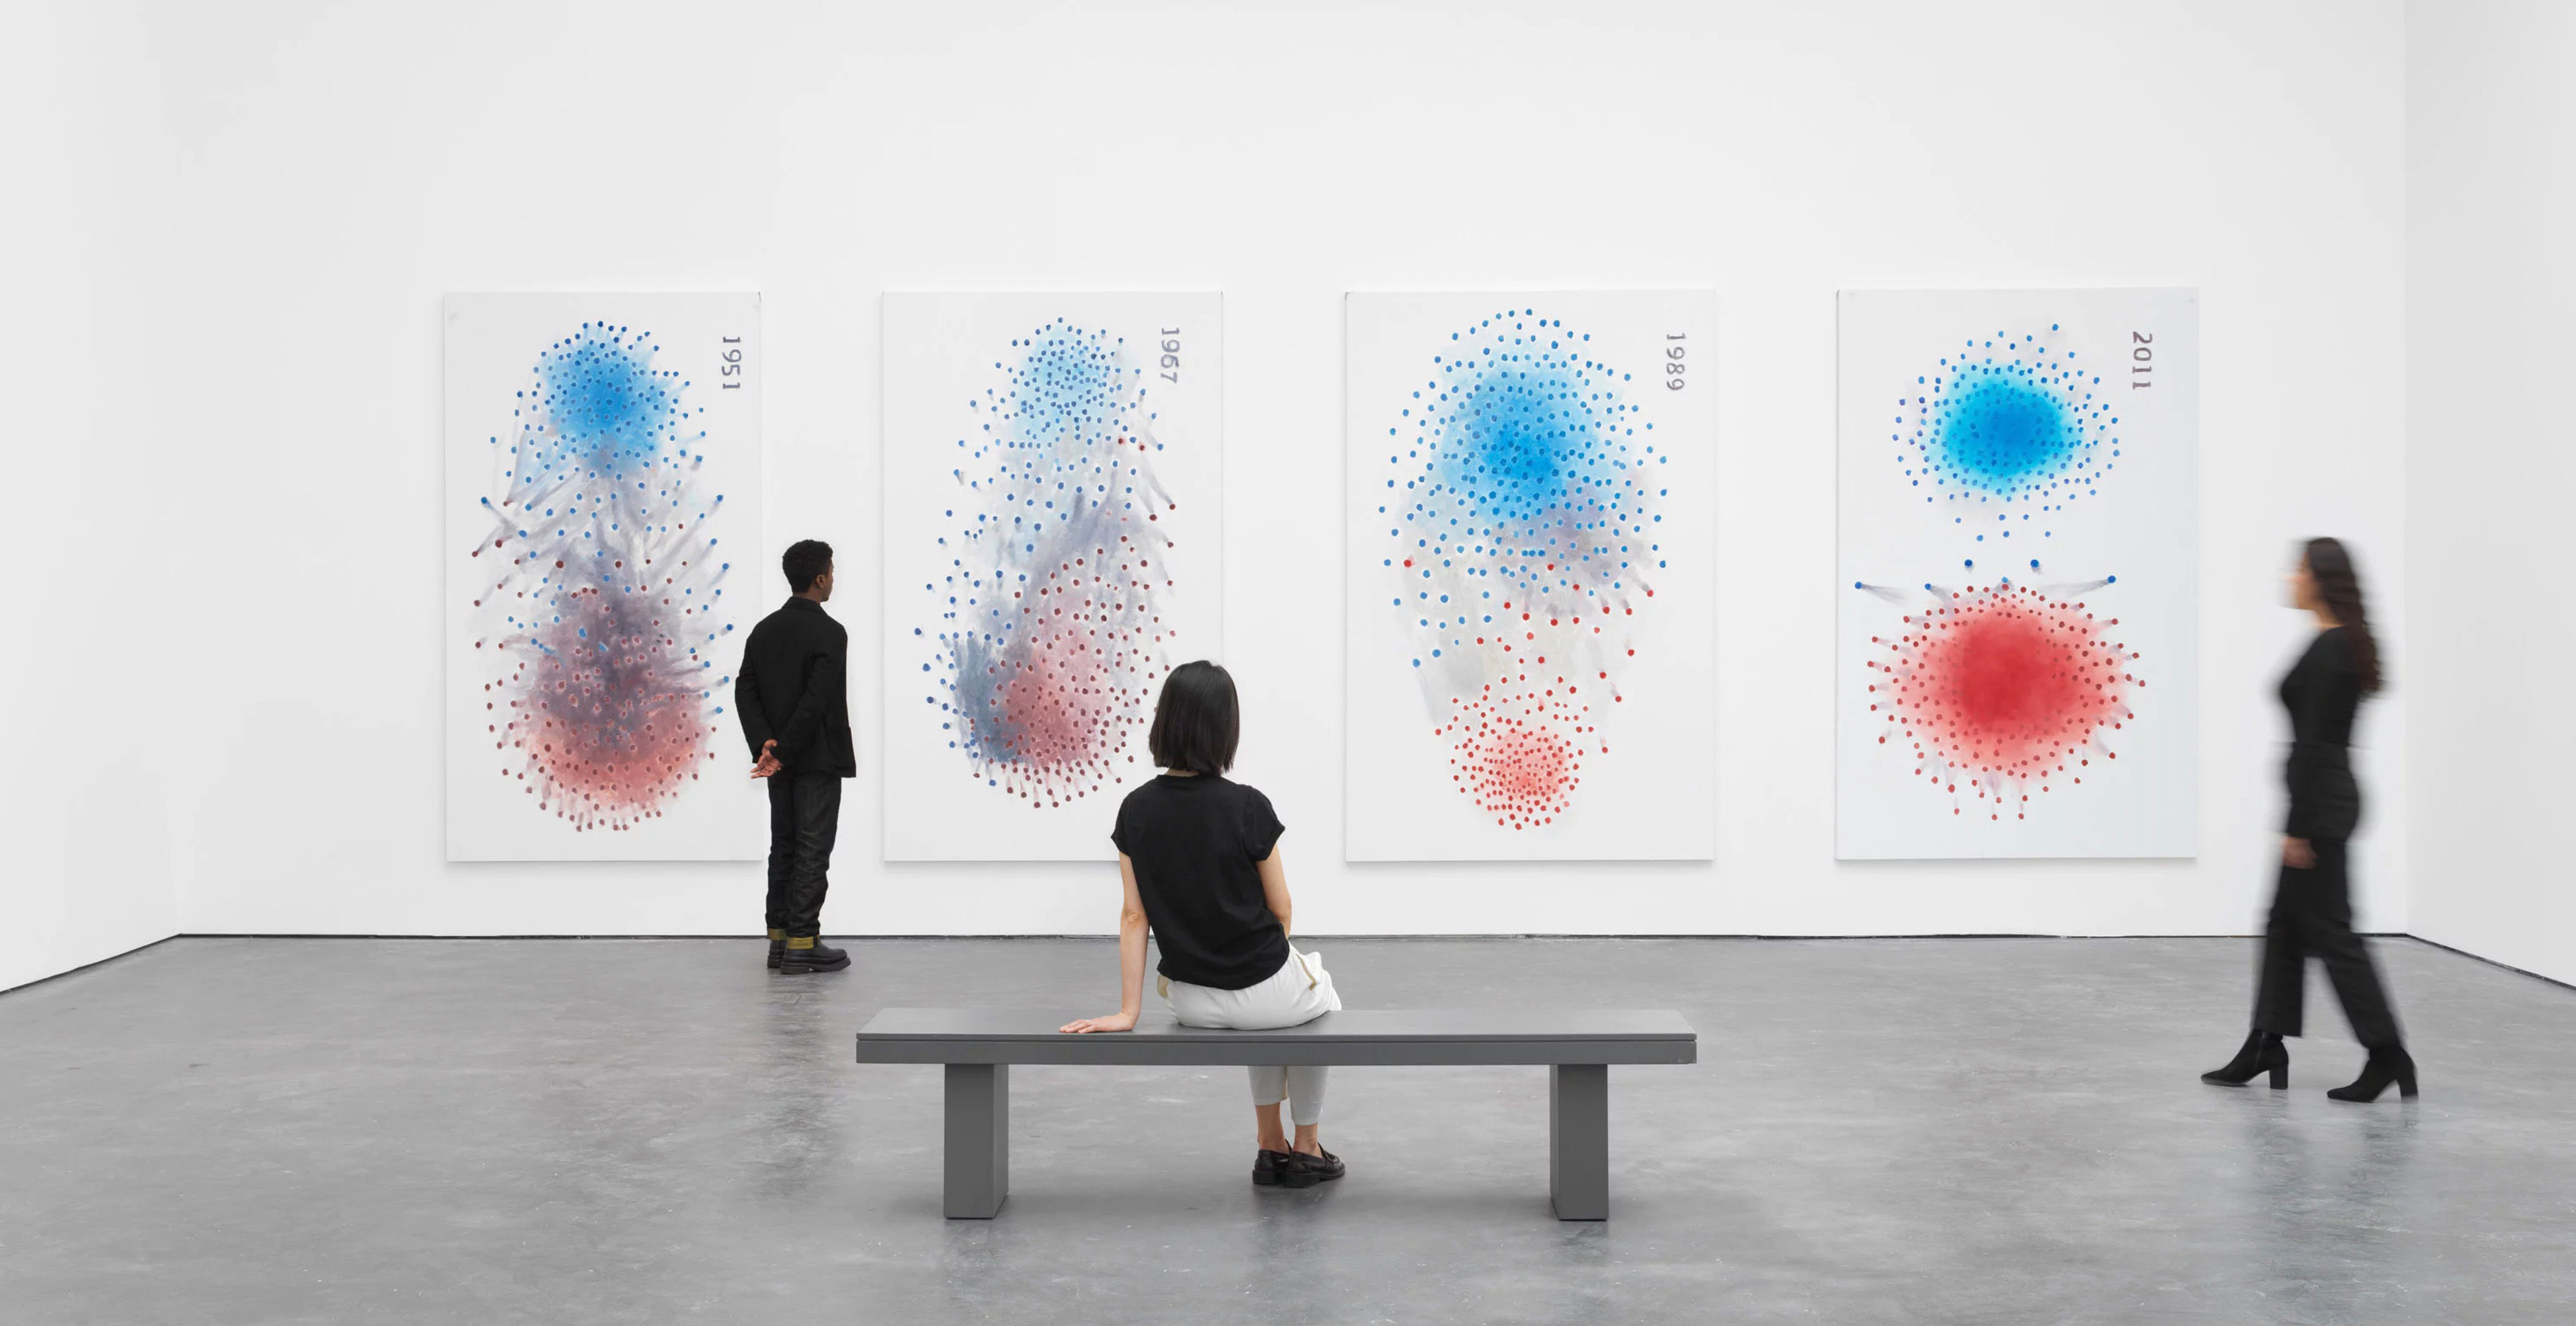 Exhibition view, David Zwirner, Paris
Exhibition view, David Zwirner, Paris
Exhibition view, David Zwirner, Paris